North West River Basin District
About
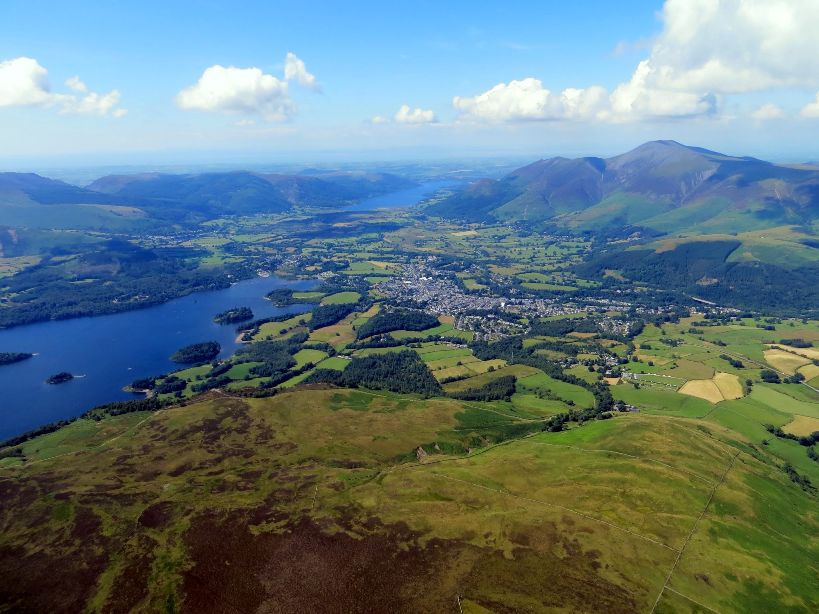
The North West river basin district covers approximately 13,200km2. It extends from Cumbria in the north and includes parts of Staffordshire to the south, parts of North Yorkshire in the east and Merseyside to the west. In total, nearly 7 million people live and work in the North West and the district includes large urban areas such as Liverpool and Manchester. The North West river basin district has a rich diversity of wildlife and habitats, supporting many species of global and national importance. These include migratory salmon rivers with native white clawed crayfish and pearl mussel populations and lakes containing the Arctic char and the rare vendace. The management catchments that make up the river basin district include many interconnected rivers, lakes, groundwater and coastal waters. These catchments include, for example, lakes and rivers in the Lake District and significant sandstone aquifers used for public water abstraction. Around 80% of the river basin district is rural, with the majority of land being used for agriculture. Livestock farming is the most common rural land use, which has shaped much of the landscape. The Lake District and Lancashire coast are tourism centres and make a significant contribution to the local economy.
Classifications data for North West River Basin District
Number of water bodies
The number of water bodies in the river basin district. It shows whether these are natural, artificial (such as canals and reservoirs) or have been modified ('heavily modified') for particular uses.
| Water body categories | Natural | Artificial | Heavily modified | Total |
|---|---|---|---|---|
| River, canals and surface water transfers | 260 | 25 | 153 | 438 |
| Lake | 30 | 10 | 106 | 146 |
| Coastal | 2 | 0 | 3 | 5 |
| Estuarine | 4 | 0 | 7 | 11 |
| Groundwater | 18 | 0 | 0 | 18 |
| Total | 314 | 35 | 269 | 618 |
Ecological status for surface waters
Table summarises the current ecological status of surface water bodies. Water bodies are classified as being at high, good, moderate, poor or bad ecological status or potential.
| Ecological status or potential | Bad | Poor | Moderate | Good | High | Total |
|---|---|---|---|---|---|---|
| Number of water bodies | 17 | 61 | 390 | 130 | 1 | 599 |
| Number of water body elements | 88 | 286 | 656 | 778 | 3268 | 5076 |
Chemical status for surface waters
Table summarises the current chemical status of water bodies. These are classified as being at good or fail.
| Chemical status | Fail | Good | Total |
|---|---|---|---|
| Number of water bodies | 599 | 0 | 599 |
| Number of water body elements | 1480 | 6861 | 8341 |
Quantitative status for groundwater
Table summarises the quantitative status of groundwater water bodies. These are classified as being at good or poor.
| Quantitative status | Poor | Good | Total |
|---|---|---|---|
| Number of water bodies | 5 | 13 | 18 |
| Number of water body elements | 5 | 67 | 72 |
Chemical status for groundwater
Table summarises the chemical status of groundwater water bodies. These are classified as being at good or poor.
| Chemical status | Poor | Good | Total |
|---|---|---|---|
| Number of water bodies | 10 | 8 | 18 |
| Number of water body elements | 16 | 74 | 90 |
Challenges data for North West River Basin District
Reasons for not achieving good status by business sector
The issues preventing waters reaching good status and the sectors identified as contributing to them. The numbers in the table are individual counts of the reasons for not achieving good status with a confidence status of 'confirmed' and 'probable', where the latest classification is less than good status. There may be more than one reason in a single water body. Note, table does not include reasons for deterioration.
| Significant water management issue | Changes to the natural flow and level of water | Invasive non-native species | Physical modifications | Pollution from abandoned mines | Pollution from rural areas | Pollution from towns, cities and transport | Pollution from waste water |
|---|---|---|---|---|---|---|---|
| Agriculture and rural land management | 1 | 0 | 18 | 0 | 735 | 1 | 0 |
| Domestic general public | 0 | 0 | 0 | 0 | 0 | 69 | 14 |
| Industry | 2 | 0 | 13 | 0 | 0 | 36 | 2 |
| Local & central government | 0 | 0 | 76 | 0 | 0 | 0 | 0 |
| Mining and quarrying | 0 | 0 | 1 | 21 | 0 | 0 | 0 |
| Navigation | 0 | 0 | 9 | 0 | 0 | 1 | 0 |
| No sector responsible | 0 | 3 | 0 | 0 | 0 | 0 | 0 |
| Other | 0 | 0 | 10 | 0 | 0 | 4 | 0 |
| Recreation | 0 | 0 | 6 | 0 | 0 | 0 | 0 |
| Sector under investigation | 0 | 0 | 134 | 0 | 0 | 0 | 0 |
| Urban and transport | 0 | 0 | 101 | 0 | 0 | 102 | 17 |
| Waste treatment and disposal | 0 | 0 | 0 | 0 | 0 | 1 | 1 |
| Water Industry | 4 | 0 | 53 | 0 | 0 | 3 | 309 |
| Total | 7 | 3 | 421 | 21 | 735 | 217 | 343 |
Objectives data for North West River Basin District
Ecological status or potential objectives for surface water bodies
Table summarises the ecological status and ecological potential objectives set for water bodies in the river basin management plan. Each water body is only counted once in this table. Each water body objective consists of a target status and a date when it was, or is expected to be, met.
| Status | Bad | Poor | Moderate | Good | High | Total |
|---|---|---|---|---|---|---|
| By 2015 | 1 | 1 | 42 | 131 | 0 | 175 |
| By 2021 | 0 | 0 | 4 | 28 | 0 | 32 |
| By 2027 | 0 | 2 | 19 | 371 | 0 | 392 |
| Total | 1 | 3 | 65 | 530 | 0 | 599 |
Chemical status objectives for surface water bodies
Including those with less stringent objectives and extended deadlines
| Status | Fail | Good | Total |
|---|---|---|---|
| By 2063 | 0 | 598 | 598 |
| Total | 0 | 598 | 598 |
Quantitative status objectives for groundwater
Including those with less stringent objectives and extended deadlines
| Status | Poor | Good | Total |
|---|---|---|---|
| By 2015 | 0 | 14 | 14 |
| By 2021 | 0 | 1 | 1 |
| By 2027 | 0 | 3 | 3 |
| Total | 0 | 18 | 18 |
Chemical status objectives for groundwater
Including those with less stringent objectives and extended deadlines
| Status | Poor | Good | Total |
|---|---|---|---|
| By 2015 | 1 | 6 | 7 |
| By 2021 | 0 | 3 | 3 |
| By 2027 | 0 | 8 | 8 |
| Total | 1 | 17 | 18 |