Thames River Basin District
About
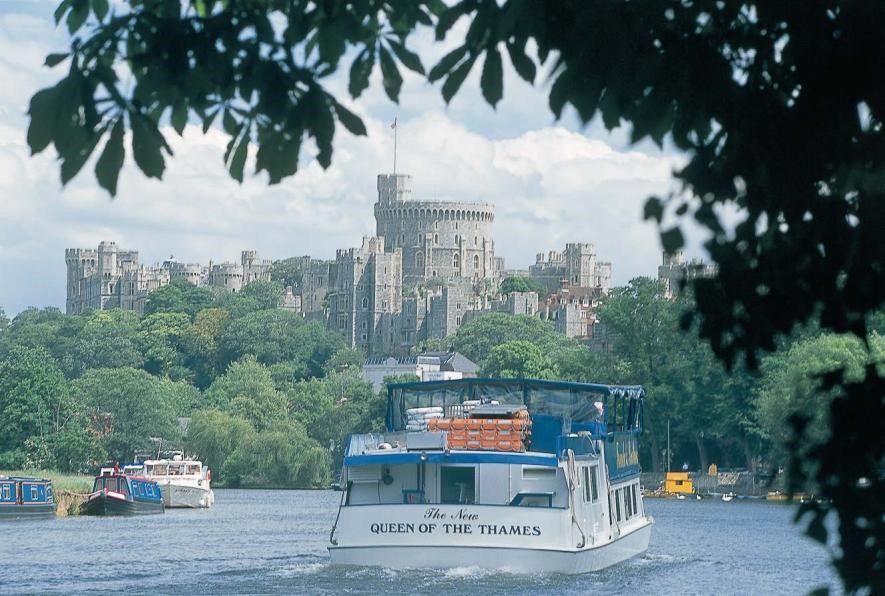
The Thames river basin district covers over 16,200km2. It encompasses all of Greater London and extends from north Oxfordshire southwards to Surrey and from Gloucester in the west to the Thames Estuary and parts of Kent in the east. In total over 15 million people live in the Thames district with many entering daily to work or visit. In addition to Greater London, other urban centres in the river basin district include Luton, Reading and Guildford. The Thames river basin district has a rich diversity of wildlife and habitats, supporting many species of global and national importance from chalk streams such as the River Kennet to the Thames Estuary and salt marshes. The management catchments that make up the river basin district include many interconnected rivers, lakes, groundwater, estuarine and coastal waters. These catchments range from chalk streams and aquifers to tidal and coastal marshes. The river basin district is mostly rural to the west and very urban to the east where it is dominated by Greater London. Around 17% of the river basin district is urbanised and the rural land is mainly arable, grassland and woodland. The economy is dominated by Greater London and the finance sector.
Classifications data for Thames River Basin District
Number of water bodies
The number of water bodies in the river basin district. It shows whether these are natural, artificial (such as canals and reservoirs) or have been modified ('heavily modified') for particular uses.
| Water body categories | Natural | Artificial | Heavily modified | Total |
|---|---|---|---|---|
| River, canals and surface water transfers | 288 | 21 | 108 | 417 |
| Lake | 8 | 47 | 18 | 73 |
| Coastal | 0 | 0 | 1 | 1 |
| Estuarine | 3 | 2 | 5 | 10 |
| Groundwater | 47 | 0 | 0 | 47 |
| Total | 346 | 70 | 132 | 548 |
Ecological status for surface waters
Table summarises the current ecological status of surface water bodies. Water bodies are classified as being at high, good, moderate, poor or bad ecological status or potential.
| Ecological status or potential | Bad | Poor | Moderate | Good | High | Total |
|---|---|---|---|---|---|---|
| Number of water bodies | 19 | 117 | 334 | 31 | 0 | 501 |
| Number of water body elements | 121 | 381 | 623 | 554 | 2861 | 4540 |
Chemical status for surface waters
Table summarises the current chemical status of water bodies. These are classified as being at good or fail.
| Chemical status | Fail | Good | Total |
|---|---|---|---|
| Number of water bodies | 500 | 0 | 500 |
| Number of water body elements | 1098 | 6328 | 7426 |
Quantitative status for groundwater
Table summarises the quantitative status of groundwater water bodies. These are classified as being at good or poor.
| Quantitative status | Poor | Good | Total |
|---|---|---|---|
| Number of water bodies | 17 | 30 | 47 |
| Number of water body elements | 25 | 163 | 188 |
Chemical status for groundwater
Table summarises the chemical status of groundwater water bodies. These are classified as being at good or poor.
| Chemical status | Poor | Good | Total |
|---|---|---|---|
| Number of water bodies | 29 | 18 | 47 |
| Number of water body elements | 42 | 193 | 235 |
Challenges data for Thames River Basin District
Reasons for not achieving good status by business sector
The issues preventing waters reaching good status and the sectors identified as contributing to them. The numbers in the table are individual counts of the reasons for not achieving good status with a confidence status of 'confirmed' and 'probable', where the latest classification is less than good status. There may be more than one reason in a single water body. Note, table does not include reasons for deterioration.
| Significant water management issue | Changes to the natural flow and level of water | Invasive non-native species | Physical modifications | Pollution from abandoned mines | Pollution from rural areas | Pollution from towns, cities and transport | Pollution from waste water |
|---|---|---|---|---|---|---|---|
| Agriculture and rural land management | 10 | 0 | 110 | 0 | 388 | 6 | 0 |
| Domestic general public | 0 | 0 | 1 | 0 | 0 | 167 | 5 |
| Industry | 3 | 0 | 9 | 0 | 0 | 30 | 3 |
| Local & central government | 0 | 0 | 120 | 0 | 0 | 0 | 0 |
| Mining and quarrying | 0 | 0 | 1 | 4 | 0 | 0 | 0 |
| Navigation | 2 | 0 | 30 | 0 | 0 | 1 | 0 |
| No sector responsible | 0 | 31 | 2 | 0 | 0 | 0 | 0 |
| Other | 1 | 0 | 65 | 0 | 0 | 18 | 0 |
| Recreation | 2 | 0 | 59 | 0 | 0 | 0 | 0 |
| Sector under investigation | 0 | 0 | 5 | 0 | 0 | 0 | 0 |
| Urban and transport | 0 | 0 | 248 | 0 | 0 | 173 | 6 |
| Waste treatment and disposal | 0 | 0 | 0 | 0 | 0 | 0 | 0 |
| Water Industry | 72 | 0 | 24 | 0 | 0 | 23 | 548 |
| Total | 90 | 31 | 674 | 4 | 388 | 418 | 562 |
Objectives data for Thames River Basin District
Ecological status or potential objectives for surface water bodies
Table summarises the ecological status and ecological potential objectives set for water bodies in the river basin management plan. Each water body is only counted once in this table. Each water body objective consists of a target status and a date when it was, or is expected to be, met.
| Status | Bad | Poor | Moderate | Good | High | Total |
|---|---|---|---|---|---|---|
| By 2015 | 5 | 12 | 133 | 32 | 0 | 182 |
| By 2021 | 0 | 2 | 7 | 14 | 0 | 23 |
| By 2027 | 0 | 1 | 13 | 245 | 0 | 259 |
| By 2033 | 0 | 0 | 0 | 7 | 0 | 7 |
| By 2039 | 0 | 0 | 2 | 28 | 0 | 30 |
| Total | 5 | 15 | 155 | 326 | 0 | 501 |
Chemical status objectives for surface water bodies
Including those with less stringent objectives and extended deadlines
| Status | Fail | Good | Total |
|---|---|---|---|
| By 2063 | 0 | 500 | 500 |
| Total | 0 | 500 | 500 |
Quantitative status objectives for groundwater
Including those with less stringent objectives and extended deadlines
| Status | Poor | Good | Total |
|---|---|---|---|
| By 2015 | 9 | 25 | 34 |
| By 2021 | 0 | 9 | 9 |
| By 2027 | 0 | 4 | 4 |
| Total | 9 | 38 | 47 |
Chemical status objectives for groundwater
Including those with less stringent objectives and extended deadlines
| Status | Poor | Good | Total |
|---|---|---|---|
| By 2015 | 1 | 23 | 24 |
| By 2021 | 0 | 1 | 1 |
| By 2027 | 0 | 19 | 19 |
| By 2050 | 0 | 3 | 3 |
| Total | 1 | 46 | 47 |