Test and Itchen Management Catchment
About
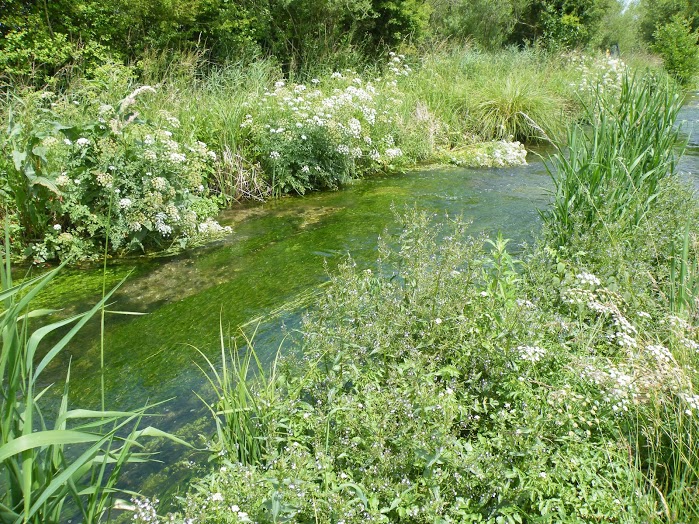
This predominantly rural catchment covers an area of approximately 1,760 square kilometres, and contains two rivers popularly regarded as two of the finest chalk streams in the world with their crystal clear waters supporting a rich diversity of mammal, bird, fish, invertebrate and plant communities. Both rivers are classified as Sites of Special Scientific Interest throughout their courses, with the Itchen additionally designated as a Special Area of Conservation. They are both internationally famous for their trout and salmon fishing, and support local watercress and commercial fish farming, which rely on the high water quality resulting from the groundwater. The geology of the catchment is dominated in the north by chalk, which provides the groundwater upon which both rivers are dependent. The major urban locations in this part of the catchment are Andover, Romsey and Winchester. In contrast, the geology of the southern part of the catchment is dominated by clay, and demonstrates very different stream characteristics. Major urban areas here are concentrated along the coast, such as Southampton, Totton and Eastleigh. The Test & Itchen catchments supply much of Hampshires public water needs, as well as a significant proportion of the Isle of Wights public water requirements. Both rivers have been modified in many ways, and now have many structures and multiple or braided channels along their lengths, supporting mills, navigation and water meadows, which have led to alterations in the flow of these watercourses. Both of these rivers drain into Southampton Water, and in turn, into the Solent.
Classifications data for Test and Itchen Management Catchment
Number of water bodies
The number of water bodies in the river basin district. It shows whether these are natural, artificial (such as canals and reservoirs) or have been modified ('heavily modified') for particular uses.
| Water body categories | Natural | Artificial | Heavily modified | Total |
|---|---|---|---|---|
| River, canals and surface water transfers | 20 | 0 | 10 | 30 |
| Lake | 1 | 0 | 1 | 2 |
| Coastal | 0 | 0 | 0 | 0 |
| Estuarine | 0 | 0 | 0 | 0 |
| Groundwater | 0 | 0 | 0 | 0 |
| Total | 21 | 0 | 11 | 32 |
Ecological status for surface waters
Table summarises the current ecological status of surface water bodies. Water bodies are classified as being at high, good, moderate, poor or bad ecological status or potential.
| Ecological status or potential | Bad | Poor | Moderate | Good | High | Total |
|---|---|---|---|---|---|---|
| Number of water bodies | 1 | 0 | 17 | 14 | 0 | 32 |
| Number of water body elements | 3 | 7 | 16 | 36 | 267 | 329 |
Chemical status for surface waters
Table summarises the current chemical status of water bodies. These are classified as being at good or fail.
| Chemical status | Fail | Good | Total |
|---|---|---|---|
| Number of water bodies | 32 | 0 | 32 |
| Number of water body elements | 70 | 459 | 529 |
Quantitative status for groundwater
Table summarises the quantitative status of groundwater water bodies. These are classified as being at good or poor.
| Quantitative status | Poor | Good | Total |
|---|---|---|---|
| Number of water bodies | 0 | 0 | 0 |
| Number of water body elements | 0 | 0 | 0 |
Chemical status for groundwater
Table summarises the chemical status of groundwater water bodies. These are classified as being at good or poor.
| Chemical status | Poor | Good | Total |
|---|---|---|---|
| Number of water bodies | 0 | 0 | 0 |
| Number of water body elements | 0 | 0 | 0 |
Challenges data for Test and Itchen Management Catchment
Reasons for not achieving good status by business sector
The issues preventing waters reaching good status and the sectors identified as contributing to them. The numbers in the table are individual counts of the reasons for not achieving good status with a confidence status of 'confirmed' and 'probable', where the latest classification is less than good status. There may be more than one reason in a single water body. Note, table does not include reasons for deterioration.
| Significant water management issue | Changes to the natural flow and level of water | Invasive non-native species | Physical modifications | Pollution from abandoned mines | Pollution from rural areas | Pollution from towns, cities and transport | Pollution from waste water |
|---|---|---|---|---|---|---|---|
| Agriculture and rural land management | 0 | 0 | 1 | 0 | 4 | 0 | 0 |
| Domestic general public | 0 | 0 | 0 | 0 | 0 | 1 | 0 |
| Industry | 0 | 0 | 0 | 0 | 0 | 0 | 0 |
| Local & central government | 0 | 0 | 8 | 0 | 0 | 0 | 0 |
| Mining and quarrying | 0 | 0 | 0 | 0 | 0 | 0 | 0 |
| Navigation | 0 | 0 | 0 | 0 | 0 | 0 | 0 |
| No sector responsible | 0 | 1 | 0 | 0 | 0 | 0 | 0 |
| Other | 0 | 0 | 3 | 0 | 0 | 0 | 0 |
| Recreation | 0 | 0 | 3 | 0 | 0 | 0 | 0 |
| Sector under investigation | 0 | 0 | 1 | 0 | 0 | 0 | 0 |
| Urban and transport | 0 | 0 | 16 | 0 | 0 | 1 | 0 |
| Waste treatment and disposal | 0 | 0 | 0 | 0 | 0 | 0 | 0 |
| Water Industry | 0 | 0 | 0 | 0 | 0 | 0 | 4 |
| Total | 0 | 1 | 32 | 0 | 4 | 2 | 4 |
Objectives data for Test and Itchen Management Catchment
Ecological status or potential objectives for surface water bodies
Table summarises the ecological status and ecological potential objectives set for water bodies in the river basin management plan. Each water body is only counted once in this table. Each water body objective consists of a target status and a date when it was, or is expected to be, met.
| Status | Bad | Poor | Moderate | Good | High | Total |
|---|---|---|---|---|---|---|
| By 2015 | 0 | 0 | 0 | 13 | 0 | 13 |
| By 2021 | 0 | 0 | 0 | 2 | 0 | 2 |
| By 2027 | 0 | 0 | 0 | 17 | 0 | 17 |
| Total | 0 | 0 | 0 | 32 | 0 | 32 |
Chemical status objectives for surface water bodies
Including those with less stringent objectives and extended deadlines
| Status | Fail | Good | Total |
|---|---|---|---|
| By 2063 | 0 | 32 | 32 |
| Total | 0 | 32 | 32 |
Quantitative status objectives for groundwater
Including those with less stringent objectives and extended deadlines
| Status | Poor | Good | Total |
|---|---|---|---|
| Total | 0 | 0 | 0 |
Chemical status objectives for groundwater
Including those with less stringent objectives and extended deadlines
| Status | Poor | Good | Total |
|---|---|---|---|
| Total | 0 | 0 | 0 |
Summary Statistics data for Test and Itchen Management Catchment
Ecological status and potential
| Summary statistic | Rivers, Canals and SWTs | Lakes | Estuaries | Coastal | Surface Waters Combined |
|---|---|---|---|---|---|
| % of water bodies at good or better ecological status/potential | 47% | 0% | 44% | ||
| % of biological elements, phys-chem elements and specific pollutants at good or better status | 92% | 75% | 92% | ||
| % of water bodies with an objective of good ecological status/potential or better | 100% | 100% | 100% | ||
| % of biological elements, phys-chem elements and Specific Pollutants with an objective of good status or better | 100% | 100% | 100% |
Chemical
| Summary statistic | Rivers, Canals and SWTs | Lakes | Estuaries | Coastal | Surface Waters Combined |
|---|---|---|---|---|---|
| % of water bodies at good chemical status | 0% | 0% | 0% | ||
| % of chemical elements at good status | 87% | 80% | 87% | ||
| % of water bodies at good chemical status without uPBT | 97% | 100% | 97% | ||
| % of chemical elements at good status without uPBT | Greater than 99% | 100% | Greater than 99% | ||
| % of water bodies with an objective of good chemical status | 100% | 100% | 100% | ||
| % of chemical elements with an objective of good | 100% | 100% | 100% | ||
| % of water bodies with an objective of good chemical status without uPBT | 100% | 100% | 100% | ||
| % of chemical elements with an objective of good without uPBTs | 100% | 100% | 100% |