Trent Valley Staffordshire Management Catchment
About
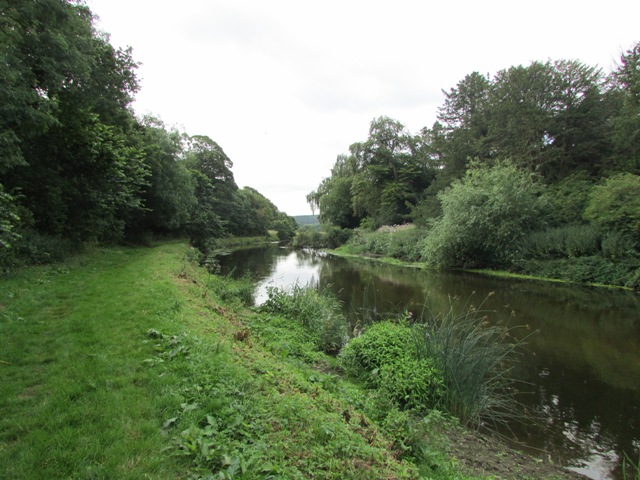
The catchment covers the River Trent and its tributaries from north of Stoke-on-Trent to Trents confluence with the Tame near Alrewas. The Trent and Mersey Canal follows the course of the Trent through the catchment joining the River for a short section at Alrewas. The catchment also includes sections of other canals most notably the Staffs and Worcester and Shropshire Union. The upper stretch of the Trent flows through the urban conurbations of Stoke-on-Trent and Newcastle-under-Lyme and is joined by a number of smaller urban tributaries. The rural Trents main tributaries are the Rivers Sow and Blithe. The River Sow rises in the north-west of the catchment, flows south-west through Stafford joining the Trent near Shugborough. The Penk rises to the north-west of Wolverhampton and joins the Sow at Stafford. The Blithe rises to the East of Stoke-on-Trent and flows south-east joining the Trent at Nethertown. The river is impounded at Blithfield Reservoir where the water is abstracted for public water supply by South Staffordshire Water. The lower section of the Trent and tributaries comprises of a somewhat fragmented landscape of urban development intermixed with pastoral and arable land. Cannock Chase Area of Outstanding Natural Beauty lies to the southern edge of the catchment. The east of the catchment forms part of the National Forest, a landscape scale project that is looking to blend ancient woodland with new planting. The River Swarbourn flows through the National Forest joining the Trent at Wychnor.
Classifications data for Trent Valley Staffordshire Management Catchment
Number of water bodies
The number of water bodies in the river basin district. It shows whether these are natural, artificial (such as canals and reservoirs) or have been modified ('heavily modified') for particular uses.
| Water body categories | Natural | Artificial | Heavily modified | Total |
|---|---|---|---|---|
| River, canals and surface water transfers | 31 | 0 | 6 | 37 |
| Lake | 1 | 0 | 3 | 4 |
| Coastal | 0 | 0 | 0 | 0 |
| Estuarine | 0 | 0 | 0 | 0 |
| Groundwater | 0 | 0 | 0 | 0 |
| Total | 32 | 0 | 9 | 41 |
Ecological status for surface waters
Table summarises the current ecological status of surface water bodies. Water bodies are classified as being at high, good, moderate, poor or bad ecological status or potential.
| Ecological status or potential | Bad | Poor | Moderate | Good | High | Total |
|---|---|---|---|---|---|---|
| Number of water bodies | 4 | 22 | 14 | 1 | 0 | 41 |
| Number of water body elements | 10 | 59 | 54 | 48 | 226 | 397 |
Chemical status for surface waters
Table summarises the current chemical status of water bodies. These are classified as being at good or fail.
| Chemical status | Fail | Good | Total |
|---|---|---|---|
| Number of water bodies | 41 | 0 | 41 |
| Number of water body elements | 94 | 480 | 574 |
Quantitative status for groundwater
Table summarises the quantitative status of groundwater water bodies. These are classified as being at good or poor.
| Quantitative status | Poor | Good | Total |
|---|---|---|---|
| Number of water bodies | 0 | 0 | 0 |
| Number of water body elements | 0 | 0 | 0 |
Chemical status for groundwater
Table summarises the chemical status of groundwater water bodies. These are classified as being at good or poor.
| Chemical status | Poor | Good | Total |
|---|---|---|---|
| Number of water bodies | 0 | 0 | 0 |
| Number of water body elements | 0 | 0 | 0 |
Challenges data for Trent Valley Staffordshire Management Catchment
Reasons for not achieving good status by business sector
The issues preventing waters reaching good status and the sectors identified as contributing to them. The numbers in the table are individual counts of the reasons for not achieving good status with a confidence status of 'confirmed' and 'probable', where the latest classification is less than good status. There may be more than one reason in a single water body. Note, table does not include reasons for deterioration.
| Significant water management issue | Changes to the natural flow and level of water | Invasive non-native species | Physical modifications | Pollution from abandoned mines | Pollution from rural areas | Pollution from towns, cities and transport | Pollution from waste water |
|---|---|---|---|---|---|---|---|
| Agriculture and rural land management | 0 | 0 | 5 | 0 | 66 | 0 | 0 |
| Domestic general public | 0 | 0 | 0 | 0 | 0 | 4 | 1 |
| Industry | 0 | 0 | 0 | 0 | 0 | 1 | 0 |
| Local & central government | 0 | 0 | 5 | 0 | 0 | 0 | 0 |
| Mining and quarrying | 0 | 0 | 1 | 1 | 0 | 0 | 0 |
| Navigation | 0 | 0 | 0 | 0 | 0 | 0 | 0 |
| No sector responsible | 0 | 0 | 0 | 0 | 0 | 0 | 0 |
| Other | 0 | 0 | 2 | 0 | 0 | 0 | 0 |
| Recreation | 0 | 0 | 0 | 0 | 0 | 0 | 0 |
| Sector under investigation | 0 | 0 | 0 | 0 | 0 | 0 | 0 |
| Urban and transport | 0 | 0 | 11 | 0 | 0 | 41 | 0 |
| Waste treatment and disposal | 0 | 0 | 0 | 0 | 0 | 1 | 0 |
| Water Industry | 5 | 0 | 5 | 0 | 0 | 0 | 46 |
| Total | 5 | 0 | 29 | 1 | 66 | 47 | 47 |
Objectives data for Trent Valley Staffordshire Management Catchment
Ecological status or potential objectives for surface water bodies
Table summarises the ecological status and ecological potential objectives set for water bodies in the river basin management plan. Each water body is only counted once in this table. Each water body objective consists of a target status and a date when it was, or is expected to be, met.
| Status | Bad | Poor | Moderate | Good | High | Total |
|---|---|---|---|---|---|---|
| By 2015 | 0 | 1 | 4 | 1 | 0 | 6 |
| By 2021 | 0 | 1 | 3 | 1 | 0 | 5 |
| By 2027 | 0 | 1 | 5 | 24 | 0 | 30 |
| Total | 0 | 3 | 12 | 26 | 0 | 41 |
Chemical status objectives for surface water bodies
Including those with less stringent objectives and extended deadlines
| Status | Fail | Good | Total |
|---|---|---|---|
| By 2063 | 0 | 41 | 41 |
| Total | 0 | 41 | 41 |
Quantitative status objectives for groundwater
Including those with less stringent objectives and extended deadlines
| Status | Poor | Good | Total |
|---|---|---|---|
| Total | 0 | 0 | 0 |
Chemical status objectives for groundwater
Including those with less stringent objectives and extended deadlines
| Status | Poor | Good | Total |
|---|---|---|---|
| Total | 0 | 0 | 0 |
Summary Statistics data for Trent Valley Staffordshire Management Catchment
Ecological status and potential
| Summary statistic | Rivers, Canals and SWTs | Lakes | Estuaries | Coastal | Surface Waters Combined |
|---|---|---|---|---|---|
| % of water bodies at good or better ecological status/potential | 3% | 0% | 2% | ||
| % of biological elements, phys-chem elements and specific pollutants at good or better status | 70% | 33% | 68% | ||
| % of water bodies with an objective of good ecological status/potential or better | 65% | 50% | 63% | ||
| % of biological elements, phys-chem elements and Specific Pollutants with an objective of good status or better | 96% | 79% | 95% |
Chemical
| Summary statistic | Rivers, Canals and SWTs | Lakes | Estuaries | Coastal | Surface Waters Combined |
|---|---|---|---|---|---|
| % of water bodies at good chemical status | 0% | 0% | 0% | ||
| % of chemical elements at good status | 85% | 70% | 84% | ||
| % of water bodies at good chemical status without uPBT | 100% | 100% | 100% | ||
| % of chemical elements at good status without uPBT | 100% | 100% | 100% | ||
| % of water bodies with an objective of good chemical status | 100% | 100% | 100% | ||
| % of chemical elements with an objective of good | 100% | 100% | 100% | ||
| % of water bodies with an objective of good chemical status without uPBT | 100% | 100% | 100% | ||
| % of chemical elements with an objective of good without uPBTs | 100% | 100% | 100% |