We use essential cookies to give you the best online
experience. Without them, this service will not work. We also use
non-essential cookies to analyse site usage to continually improve the
services we provide you with. Full details of cookies collected,
and the functionality to change your cookie preference at any time can be
accessed on our Cookie Policy Page.
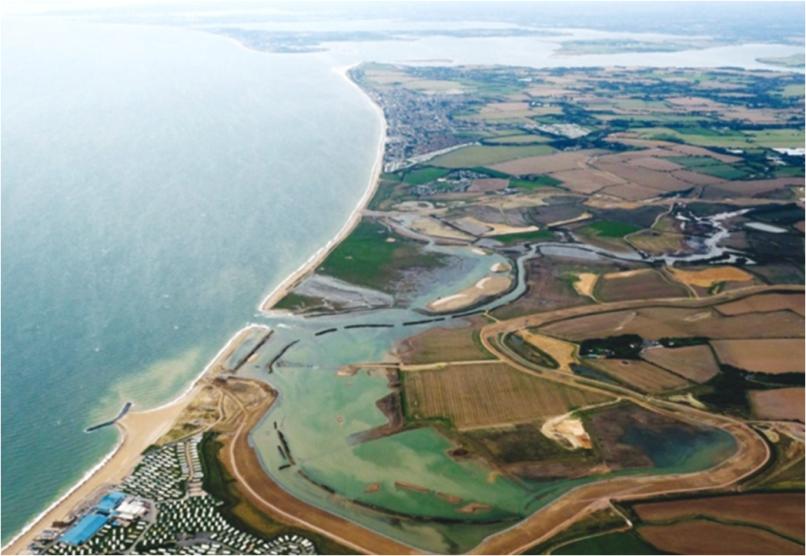
The South East river basin district covers over 10,200km2 and extends from Hampshire in the west to Kent in the east. It includes East and West Sussex, the Isle of Wight and parts of Wiltshire and Surrey.
In total over 3.5 million people live and work in the south east, which is densely populated and includes the major urban centres of Southampton, Portsmouth, Ashford, Brighton and Hove.
The South East river basin district has a rich diversity of wildlife and habitats, supporting many species of global and national importance. These include migratory salmon rivers, native white clawed crayfish, and estuaries and coastal waters important for shellfish, wintering wildfowl, breeding gulls and terns.
The management catchments that make up the river basin district include many interconnected rivers, lakes, groundwater, estuarine and coastal waters. These catchments range from chalk streams of the Test and Itchen catchments to the modified rivers of the Rother catchment.
Around 65% of the river basin district is used for farming, including livestock, arable and horticultural businesses. Important sectors contributing to the economy of the district include technology, manufacturing, tourism, financial services and construction.
Classifications data for South East River Basin District
Number of water bodies
The number of water bodies in the river basin district. It shows
whether these are natural, artificial (such as canals and reservoirs) or
have been modified ('heavily modified') for particular uses.
Water body categories
Natural
Artificial
Heavily modified
Total
River, canals and surface water transfers
138
13
70
221
Lake
6
11
10
27
Coastal
2
0
8
10
Estuarine
1
5
18
24
Groundwater
33
0
0
33
Total
180
29
106
315
Ecological status for surface waters
Table summarises the current ecological status
of surface water bodies. Water bodies are
classified as being at high, good, moderate, poor
or bad ecological status or potential.
Ecological status or potential
Bad
Poor
Moderate
Good
High
Total
Number of water bodies
10
55
172
45
0
282
Number of water body elements
45
137
329
374
1515
2400
Chemical status for surface waters
Table summarises the current chemical status of
water bodies. These are classified as being at
good or fail.
Table summarises the quantitative status of
groundwater water bodies. These are classified as
being at good or poor.
Quantitative status
Poor
Good
Total
Number of water bodies
12
21
33
Number of water body elements
12
120
132
Chemical status for groundwater
Table summarises the chemical status of
groundwater water bodies. These are classified as
being at good or poor.
Chemical status
Poor
Good
Total
Number of water bodies
16
17
33
Number of water body elements
26
139
165
Challenges data for South East River Basin District
Reasons for not achieving good status by business sector
The issues preventing waters reaching good status and the sectors
identified as contributing to them. The numbers in the table are
individual counts of the reasons for not achieving good status with a
confidence status of 'confirmed' and 'probable', where the latest
classification is less than good status. There may be more than one
reason in a single water body. Note, table does not include reasons for
deterioration.
Significant water management issue
Changes to the natural flow and level of water
Invasive non-native species
Physical modifications
Pollution from abandoned mines
Pollution from rural areas
Pollution from towns, cities and transport
Pollution from waste water
Agriculture and rural land management
7
0
76
0
292
0
0
Domestic general public
0
0
2
0
0
79
3
Industry
0
0
3
0
0
8
10
Local & central government
0
0
87
0
0
0
0
Mining and quarrying
0
0
0
3
0
0
0
Navigation
0
0
1
0
0
0
0
No sector responsible
0
8
0
0
0
0
0
Other
0
0
15
0
0
1
0
Recreation
0
0
18
0
0
0
0
Sector under investigation
0
0
21
0
0
0
0
Urban and transport
0
0
53
0
0
25
0
Waste treatment and disposal
0
0
0
0
0
0
0
Water Industry
18
0
17
0
0
9
273
Total
25
8
293
3
292
122
286
Objectives data for South East River Basin District
Ecological status or potential objectives for surface water bodies
Table summarises the ecological status and ecological potential
objectives set for water bodies in the river basin management
plan. Each water body is only counted once in this table. Each water
body objective consists of a target status and a date when it was, or
is expected to be, met.
Status
Bad
Poor
Moderate
Good
High
Total
By 2015
3
1
36
47
0
87
By 2021
0
0
2
11
0
13
By 2027
0
1
3
167
0
171
By 2033
0
0
1
9
0
10
By 2060
0
0
0
1
0
1
Total
3
2
42
235
0
282
Chemical status objectives for surface water bodies
Including those with less stringent objectives and extended deadlines
Status
Fail
Good
Total
By 2063
0
281
281
Total
0
281
281
Quantitative status objectives for groundwater
Including those with less stringent objectives and extended deadlines
Status
Poor
Good
Total
By 2015
1
17
18
By 2021
0
7
7
By 2027
0
8
8
Total
1
32
33
Chemical status objectives for groundwater
Including those with less stringent objectives and extended deadlines
Status
Poor
Good
Total
By 2015
0
17
17
By 2027
0
8
8
By 2040
0
1
1
By 2060
0
7
7
Total
0
33
33
Protected Areas data for South East River Basin District
Drinking water protected areas current status and at risk
Water body type
Number of drinking water protected areas
Number ‘at risk’
Number at poor chemical status for drinking water protected area objectives
Surface water
16
13
Does not apply to surface waters
Groundwater
33
14
14
Shellfish water protected areas current status and objectives
Number of shellfish waters
Objective
Number currently achieving standard
Number not sampled due to lack of commercial activity
23
Endeavour to observe the Shellfish Directions standard of ≤300 E.coli/100ml shellfish flesh and intravalvular liquid
2
10
Bathing water protected areas current status and objectives
Number of bathing waters
Objective
Number which met at least the sufficient classification in 2021
Number expected to achieve at least sufficient in 2022
Number at risk of not achieving sufficient in 2022
81
At least sufficient classification
80
78
2
There are 1 unassessed bathing waters
Nutrient sensitive areas (nitrate vulnerable zones)
Reason for designation
Number of NVZs
Land area (ha) covered by NVZ type
% of river basin district covered by NVZ type
High nitrates in surface waters
38
231,636
23
High nitrates in groundwater
14
285,798
28
Eutrophication in lakes or reservoirs
1
1,109
0
Eutrophication in estuaries and coastal waters
3
253,792
25
Nutrient sensitive areas (Urban Waste Water Treatment Regulations)
Reason for designation
Number of Sensitive areas
Length (KM)/Area (km2) designated
Eutrophication in rivers
13
266
Eutrophication in estuaries or coastal waters
7
74.14
Eutrophication in lakes or reservoirs
1
0.64
Habitats site (European site) protected areas*
Site type
Number of sites
Ramsar Site
11
Special Area of Conservation
18
Special Protection Area
11
Condition of underlying water-dependent Site of Special Scientific
Interest units**
*Ramsar sites are not protected areas under the Water Environment (Water Framework Directive) Regulations 2017. However they are treated in line with Special Areas of Conservation (SAC) and Special Protection Areas (SPA) as a matter of Government policy. Most Ramsar sites coincide with SACs and/or SPAs, but a small number are designated as Ramsar sites only. These are included in the water-dependent site condition data.
**Includes SSSI units underlying European sites and Ramsar sites where the habitat is water-dependent. The "RBMP-favourable" category in these tables includes units where any reasons for not being in "favourable condition", as far as can be ascertained, do not relate to the water-dependent features. As a result, all condition categories have the prefix "RBMP" to distinguish these from conventional SSSI condition reporting, in which pressures not relevant to river basin planning are included in determining site condition. Data retrieved 2019. Methodology changes mean this data does not form a continuous series with data reported in 2015.
Summary Statistics data for South East River Basin District
Ecological status and potential
Summary statistic
Rivers, Canals and SWTs
Lakes
Estuaries
Coastal
Surface Waters Combined
% of water bodies at good or better ecological status/potential
11%
37%
25%
40%
16%
% of biological elements, phys-chem elements and specific pollutants at good or better status
77%
61%
80%
95%
77%
% of water bodies with an objective of good ecological status/potential or better
85%
89%
67%
80%
83%
% of biological elements, phys-chem elements and Specific Pollutants with an objective of good status or better
97%
93%
92%
95%
97%
Chemical
Summary statistic
Rivers, Canals and SWTs
Lakes
Estuaries
Coastal
Surface Waters Combined
% of water bodies at good chemical status
0%
0%
0%
0%
0%
% of chemical elements at good status
84%
80%
86%
87%
84%
% of water bodies at good chemical status without uPBT
98%
100%
100%
100%
99%
% of chemical elements at good status without uPBT
Greater than 99%
100%
100%
100%
Greater than 99%
% of water bodies with an objective of good chemical status
Greater than 99%
100%
100%
100%
Greater than 99%
% of chemical elements with an objective of good
100%
100%
100%
100%
100%
% of water bodies with an objective of good chemical status without uPBT
100%
100%
100%
100%
100%
% of chemical elements with an objective of good without uPBTs
100%
100%
100%
100%
100%
Groundwater
Summary statistic
Ground water
% of water bodies at good chemical (GW) status
52%
% of groundwater chemical elements at good status
84%
% of water bodies with an objective of good chemical (GW) status
100%
% of groundwater chemical elements with an objective of good
100%
% of water bodies at good quantitative status
64%
% of groundwater quantitative elements at good status
91%
% of water bodies with an objective of good quantitative status
97%
% of groundwater quantitative elements with an objective of good