Avon Hampshire Management Catchment
About
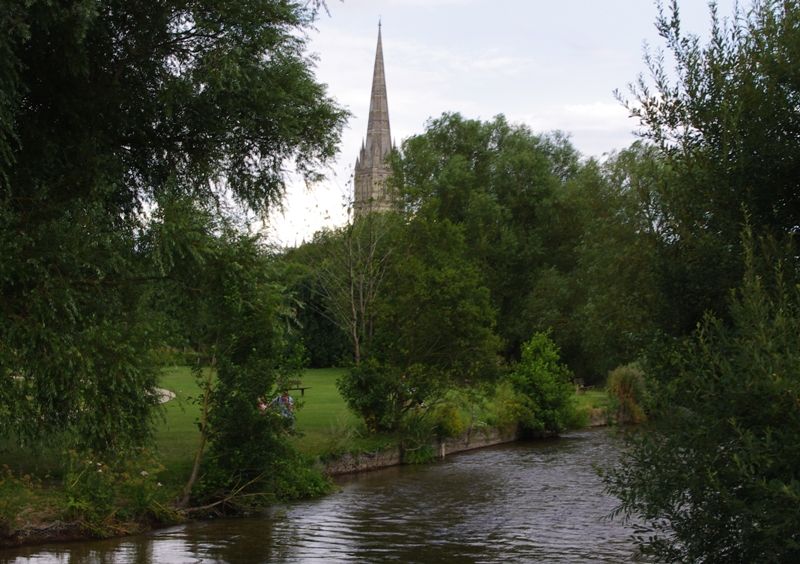
The Hampshire Avon river system flows through a region of outstanding natural and cultural heritage, with the main Wiltshire tributaries converging in Salisbury, and meeting the sea at Christchurch. The catchment support habitats and species of national and international importance, with Sites of Special Scientific Interest (SSSI), Special Area of Conservation, Special Protection Area and Ramsar designations. The overall catchment area is about 1,750 square kilometres and 205 kilometres of the river are designated as SSSI. Although predominantly a chalk river, some of the headwaters are fed by the Upper Greensand (UGS), with clay in its western headwaters, grading to sand and gravels at the lower end. Land use is predominantly rural (98%) comprising of arable, improved pasture grasslands and woodland. The Avon is considered to be one of the most bio diverse river systems in lowland Britain, supporting a very rich flora, fish and invertebrate fauna. The river is well known for its salmon and trout fisheries, although salmon numbers have been under pressure in recent years. Water resources within the Avon catchment are utilised for a number of purposes, the biggest use is public and private water supply. Other activities include general agriculture, spray irrigation, fish farming and mineral activities. In some parts of the catchment, rising phosphate and nitrate levels in the groundwater are a cause for concern. Christchurch Harbour is an important tourist and recreational hub and is internationally important for nature conservation. There are three designated bathing beaches in this area attracting large numbers of visitors.
Classifications data for Avon Hampshire Management Catchment
Number of water bodies
The number of water bodies in the river basin district. It shows whether these are natural, artificial (such as canals and reservoirs) or have been modified ('heavily modified') for particular uses.
| Water body categories | Natural | Artificial | Heavily modified | Total |
|---|---|---|---|---|
| River, canals and surface water transfers | 39 | 0 | 1 | 40 |
| Lake | 2 | 9 | 0 | 11 |
| Coastal | 0 | 0 | 0 | 0 |
| Estuarine | 0 | 0 | 0 | 0 |
| Groundwater | 0 | 0 | 0 | 0 |
| Total | 41 | 9 | 1 | 51 |
Ecological status for surface waters
Table summarises the current ecological status of surface water bodies. Water bodies are classified as being at high, good, moderate, poor or bad ecological status or potential.
| Ecological status or potential | Bad | Poor | Moderate | Good | High | Total |
|---|---|---|---|---|---|---|
| Number of water bodies | 0 | 6 | 30 | 15 | 0 | 51 |
| Number of water body elements | 0 | 13 | 44 | 65 | 301 | 423 |
Chemical status for surface waters
Table summarises the current chemical status of water bodies. These are classified as being at good or fail.
| Chemical status | Fail | Good | Total |
|---|---|---|---|
| Number of water bodies | 51 | 0 | 51 |
| Number of water body elements | 105 | 627 | 732 |
Quantitative status for groundwater
Table summarises the quantitative status of groundwater water bodies. These are classified as being at good or poor.
| Quantitative status | Poor | Good | Total |
|---|---|---|---|
| Number of water bodies | 0 | 0 | 0 |
| Number of water body elements | 0 | 0 | 0 |
Chemical status for groundwater
Table summarises the chemical status of groundwater water bodies. These are classified as being at good or poor.
| Chemical status | Poor | Good | Total |
|---|---|---|---|
| Number of water bodies | 0 | 0 | 0 |
| Number of water body elements | 0 | 0 | 0 |
Challenges data for Avon Hampshire Management Catchment
Reasons for not achieving good status by business sector
The issues preventing waters reaching good status and the sectors identified as contributing to them. The numbers in the table are individual counts of the reasons for not achieving good status with a confidence status of 'confirmed' and 'probable', where the latest classification is less than good status. There may be more than one reason in a single water body. Note, table does not include reasons for deterioration.
| Significant water management issue | Changes to the natural flow and level of water | Invasive non-native species | Physical modifications | Pollution from abandoned mines | Pollution from rural areas | Pollution from towns, cities and transport | Pollution from waste water |
|---|---|---|---|---|---|---|---|
| Agriculture and rural land management | 0 | 0 | 0 | 0 | 26 | 0 | 0 |
| Domestic general public | 0 | 0 | 0 | 0 | 0 | 2 | 0 |
| Industry | 0 | 0 | 0 | 0 | 0 | 2 | 0 |
| Local & central government | 0 | 0 | 0 | 0 | 0 | 0 | 0 |
| Mining and quarrying | 0 | 0 | 0 | 0 | 0 | 2 | 0 |
| Navigation | 0 | 0 | 0 | 0 | 0 | 0 | 0 |
| No sector responsible | 0 | 0 | 0 | 0 | 0 | 0 | 0 |
| Other | 2 | 0 | 0 | 0 | 0 | 3 | 1 |
| Recreation | 0 | 0 | 0 | 0 | 0 | 0 | 0 |
| Sector under investigation | 0 | 0 | 3 | 0 | 0 | 0 | 0 |
| Urban and transport | 0 | 0 | 0 | 0 | 0 | 3 | 0 |
| Waste treatment and disposal | 0 | 0 | 0 | 0 | 0 | 0 | 0 |
| Water Industry | 1 | 0 | 0 | 0 | 0 | 0 | 12 |
| Total | 3 | 0 | 3 | 0 | 26 | 12 | 13 |
Objectives data for Avon Hampshire Management Catchment
Ecological status or potential objectives for surface water bodies
Table summarises the ecological status and ecological potential objectives set for water bodies in the river basin management plan. Each water body is only counted once in this table. Each water body objective consists of a target status and a date when it was, or is expected to be, met.
| Status | Bad | Poor | Moderate | Good | High | Total |
|---|---|---|---|---|---|---|
| By 2015 | 0 | 3 | 10 | 14 | 0 | 27 |
| By 2021 | 0 | 0 | 0 | 4 | 0 | 4 |
| By 2027 | 0 | 0 | 1 | 19 | 0 | 20 |
| Total | 0 | 3 | 11 | 37 | 0 | 51 |
Chemical status objectives for surface water bodies
Including those with less stringent objectives and extended deadlines
| Status | Fail | Good | Total |
|---|---|---|---|
| By 2063 | 0 | 51 | 51 |
| Total | 0 | 51 | 51 |
Quantitative status objectives for groundwater
Including those with less stringent objectives and extended deadlines
| Status | Poor | Good | Total |
|---|---|---|---|
| Total | 0 | 0 | 0 |
Chemical status objectives for groundwater
Including those with less stringent objectives and extended deadlines
| Status | Poor | Good | Total |
|---|---|---|---|
| Total | 0 | 0 | 0 |