Cuckmere and Pevensey Levels Management Catchment
About
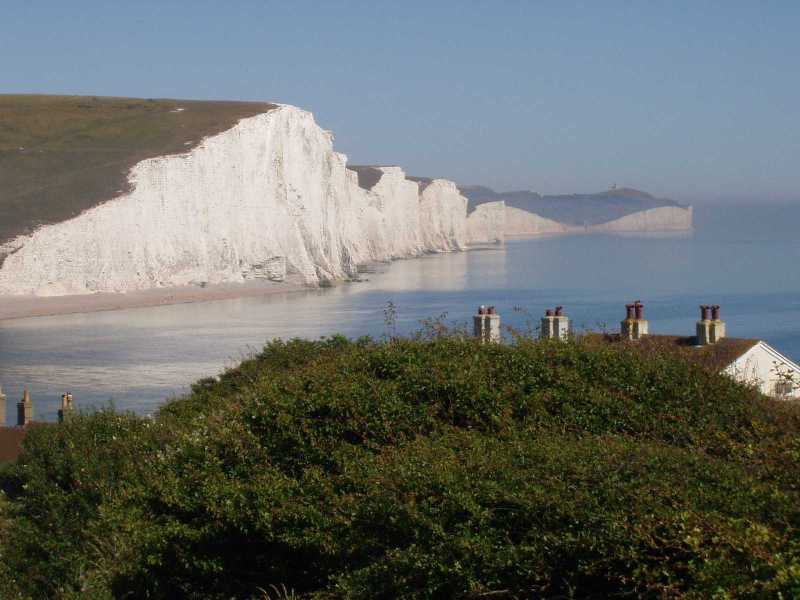
The Cuckmere and Pevensey Levels catchment is in East Sussex and consists of the rural landscape of the High and Low Weald. Within the catchment is the fast growing town of Hailsham and the coastal towns of Seaford, Eastbourne, Bexhill and Hastings. The River Cuckmere rises near Heathfield in East Sussex and flows through the South Downs to reach the English Channel at Cuckmere Haven. The catchment extends to Heathfield in the north, Hailsham to the west and from Seaford to Eastbourne along the coast. The lower part of the catchment is marked by the Cuckmere Haven, which is well known for its educational and recreation value, popular with tourists and for canoeing. The Pevensey Levels is a lowland grazing marsh covering 4,300 hectares between Eastbourne and Bexhill-on-Sea. It is one of the most environmentally important wetland areas in southern Britain, being of national and international importance for its biological diversity, including the fen raft spider. It is designated as a Site of Special Scientific Interest (SSSI), a Ramsar site and a Special Area of Conservation (SAC). To the east of the Catchment is the Combe Haven. The rural upper reaches of Powdermill and Watermill Streams drain to the Combe Haven, with the Hollington Stream merging just before it discharges to the sea. The Alexandra Park Stream and Egerton Park Stream flow through Hastings and Bexhill prior to discharging to the English Channel. Urban pressures including misconnections affect the quality of water including that of the priority bathing water at Hastings, which has a potential economic as well as environmental impact.
Classifications data for Cuckmere and Pevensey Levels Management Catchment
Number of water bodies
The number of water bodies in the river basin district. It shows whether these are natural, artificial (such as canals and reservoirs) or have been modified ('heavily modified') for particular uses.
| Water body categories | Natural | Artificial | Heavily modified | Total |
|---|---|---|---|---|
| River, canals and surface water transfers | 8 | 0 | 9 | 17 |
| Lake | 0 | 1 | 0 | 1 |
| Coastal | 0 | 0 | 0 | 0 |
| Estuarine | 0 | 0 | 0 | 0 |
| Groundwater | 0 | 0 | 0 | 0 |
| Total | 8 | 1 | 9 | 18 |
Ecological status for surface waters
Table summarises the current ecological status of surface water bodies. Water bodies are classified as being at high, good, moderate, poor or bad ecological status or potential.
| Ecological status or potential | Bad | Poor | Moderate | Good | High | Total |
|---|---|---|---|---|---|---|
| Number of water bodies | 0 | 6 | 11 | 1 | 0 | 18 |
| Number of water body elements | 2 | 14 | 26 | 25 | 94 | 161 |
Chemical status for surface waters
Table summarises the current chemical status of water bodies. These are classified as being at good or fail.
| Chemical status | Fail | Good | Total |
|---|---|---|---|
| Number of water bodies | 18 | 0 | 18 |
| Number of water body elements | 42 | 185 | 227 |
Quantitative status for groundwater
Table summarises the quantitative status of groundwater water bodies. These are classified as being at good or poor.
| Quantitative status | Poor | Good | Total |
|---|---|---|---|
| Number of water bodies | 0 | 0 | 0 |
| Number of water body elements | 0 | 0 | 0 |
Chemical status for groundwater
Table summarises the chemical status of groundwater water bodies. These are classified as being at good or poor.
| Chemical status | Poor | Good | Total |
|---|---|---|---|
| Number of water bodies | 0 | 0 | 0 |
| Number of water body elements | 0 | 0 | 0 |
Challenges data for Cuckmere and Pevensey Levels Management Catchment
Reasons for not achieving good status by business sector
The issues preventing waters reaching good status and the sectors identified as contributing to them. The numbers in the table are individual counts of the reasons for not achieving good status with a confidence status of 'confirmed' and 'probable', where the latest classification is less than good status. There may be more than one reason in a single water body. Note, table does not include reasons for deterioration.
| Significant water management issue | Changes to the natural flow and level of water | Invasive non-native species | Physical modifications | Pollution from abandoned mines | Pollution from rural areas | Pollution from towns, cities and transport | Pollution from waste water |
|---|---|---|---|---|---|---|---|
| Agriculture and rural land management | 0 | 0 | 9 | 0 | 13 | 0 | 0 |
| Domestic general public | 0 | 0 | 0 | 0 | 0 | 1 | 0 |
| Industry | 0 | 0 | 0 | 0 | 0 | 0 | 0 |
| Local & central government | 0 | 0 | 3 | 0 | 0 | 0 | 0 |
| Mining and quarrying | 0 | 0 | 0 | 0 | 0 | 0 | 0 |
| Navigation | 0 | 0 | 0 | 0 | 0 | 0 | 0 |
| No sector responsible | 0 | 2 | 0 | 0 | 0 | 0 | 0 |
| Other | 0 | 0 | 0 | 0 | 0 | 0 | 0 |
| Recreation | 0 | 0 | 0 | 0 | 0 | 0 | 0 |
| Sector under investigation | 0 | 0 | 3 | 0 | 0 | 0 | 0 |
| Urban and transport | 0 | 0 | 4 | 0 | 0 | 0 | 0 |
| Waste treatment and disposal | 0 | 0 | 0 | 0 | 0 | 0 | 0 |
| Water Industry | 0 | 0 | 0 | 0 | 0 | 0 | 30 |
| Total | 0 | 2 | 19 | 0 | 13 | 1 | 30 |
Objectives data for Cuckmere and Pevensey Levels Management Catchment
Ecological status or potential objectives for surface water bodies
Table summarises the ecological status and ecological potential objectives set for water bodies in the river basin management plan. Each water body is only counted once in this table. Each water body objective consists of a target status and a date when it was, or is expected to be, met.
| Status | Bad | Poor | Moderate | Good | High | Total |
|---|---|---|---|---|---|---|
| By 2015 | 0 | 0 | 1 | 1 | 0 | 2 |
| By 2027 | 0 | 0 | 0 | 16 | 0 | 16 |
| Total | 0 | 0 | 1 | 17 | 0 | 18 |
Chemical status objectives for surface water bodies
Including those with less stringent objectives and extended deadlines
| Status | Fail | Good | Total |
|---|---|---|---|
| By 2063 | 0 | 18 | 18 |
| Total | 0 | 18 | 18 |
Quantitative status objectives for groundwater
Including those with less stringent objectives and extended deadlines
| Status | Poor | Good | Total |
|---|---|---|---|
| Total | 0 | 0 | 0 |
Chemical status objectives for groundwater
Including those with less stringent objectives and extended deadlines
| Status | Poor | Good | Total |
|---|---|---|---|
| Total | 0 | 0 | 0 |
Summary Statistics data for Cuckmere and Pevensey Levels Management Catchment
Ecological status and potential
| Summary statistic | Rivers, Canals and SWTs | Lakes | Estuaries | Coastal | Surface Waters Combined |
|---|---|---|---|---|---|
| % of water bodies at good or better ecological status/potential | 0% | 100% | 6% | ||
| % of biological elements, phys-chem elements and specific pollutants at good or better status | 70% | 70% | |||
| % of water bodies with an objective of good ecological status/potential or better | 94% | 100% | 94% | ||
| % of biological elements, phys-chem elements and Specific Pollutants with an objective of good status or better | Greater than 99% | Greater than 99% |
Chemical
| Summary statistic | Rivers, Canals and SWTs | Lakes | Estuaries | Coastal | Surface Waters Combined |
|---|---|---|---|---|---|
| % of water bodies at good chemical status | 0% | 0% | 0% | ||
| % of chemical elements at good status | 82% | 70% | 81% | ||
| % of water bodies at good chemical status without uPBT | 94% | 100% | 94% | ||
| % of chemical elements at good status without uPBT | 99% | 100% | 99% | ||
| % of water bodies with an objective of good chemical status | 100% | 100% | 100% | ||
| % of chemical elements with an objective of good | 100% | 100% | 100% | ||
| % of water bodies with an objective of good chemical status without uPBT | 100% | 100% | 100% | ||
| % of chemical elements with an objective of good without uPBTs | 100% | 100% | 100% |