Devon East Management Catchment
About
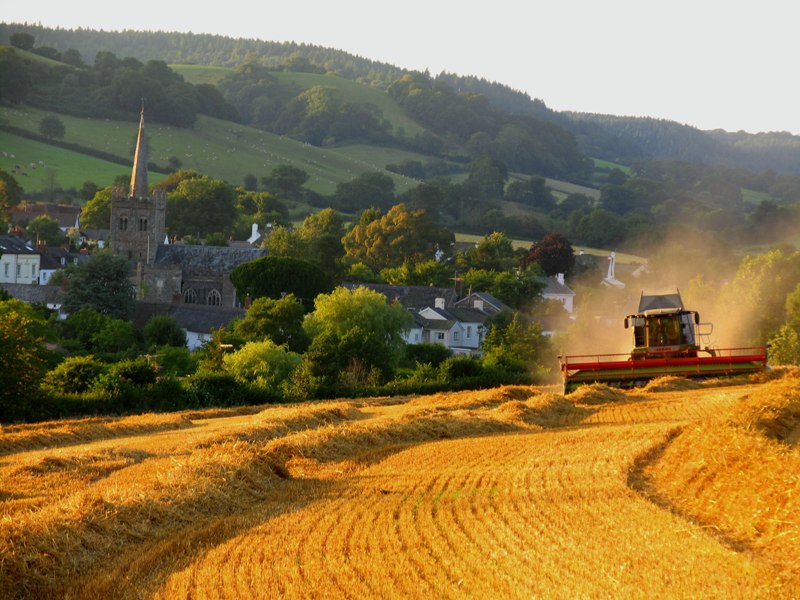
The East Devon management catchment is located in the South West of England. The majority of the catchment is located in the county of Devon, although small areas in the North and East of the catchment are located in Somerset and Dorset respectively. The major river system within the catchment is the Exe and its tributaries, including the Barle, Culm and Creedy. The Exe rises on Exmoor before flowing in roughly a southerly direction to form the Exe estuary to the south of Exeter. Other rivers within the East Devon management catchment include the Otter and Axe, both of which discharge to the south coast. The management catchment includes a broad range of landscapes. Upland moorland areas on Exmoor feature in the north of the catchment, further south the area encompasses the rolling Blackdown Hills and the eastern extremity of the Jurassic Coast. The catchment is predominantly rural with agriculture as the dominant land use. Exeter is the most significant urban area, elsewhere the inland towns Tiverton and Honiton and coastal settlements Sidmouth and Seaton also feature. There are a number of protected areas within the management catchment, including the Exmoor Heaths Special Area of Conservation (SAC) and Exmoor and Quantock Oaks SAC, both located towards the north of the management catchment. In the South the River Axe is designated as an SAC, primarily due to the maccrophyte communities it supports. The East Devon Pebblebed Heaths is designated as both an SAC and a Special Protected Area (SPA), with features including Dartford Warbler and European Nightjar. The East Devon and Blackdown Hills Areas of Outstanding Natural Beauty (AONB) feature in the South and East of the catchment, while Exmoor National Park covers the Northern area. Additionally, a number of SSSI designations are distributed across the catchment, and a large area of the middle reaches of the Exe is classified as a Drinking Water Protected Zone.
Classifications data for Devon East Management Catchment
Number of water bodies
The number of water bodies in the river basin district. It shows whether these are natural, artificial (such as canals and reservoirs) or have been modified ('heavily modified') for particular uses.
| Water body categories | Natural | Artificial | Heavily modified | Total |
|---|---|---|---|---|
| River, canals and surface water transfers | 75 | 0 | 5 | 80 |
| Lake | 2 | 0 | 1 | 3 |
| Coastal | 0 | 0 | 0 | 0 |
| Estuarine | 0 | 0 | 0 | 0 |
| Groundwater | 0 | 0 | 0 | 0 |
| Total | 77 | 0 | 6 | 83 |
Ecological status for surface waters
Table summarises the current ecological status of surface water bodies. Water bodies are classified as being at high, good, moderate, poor or bad ecological status or potential.
| Ecological status or potential | Bad | Poor | Moderate | Good | High | Total |
|---|---|---|---|---|---|---|
| Number of water bodies | 2 | 17 | 52 | 12 | 0 | 83 |
| Number of water body elements | 2 | 29 | 116 | 100 | 520 | 767 |
Chemical status for surface waters
Table summarises the current chemical status of water bodies. These are classified as being at good or fail.
| Chemical status | Fail | Good | Total |
|---|---|---|---|
| Number of water bodies | 83 | 0 | 83 |
| Number of water body elements | 175 | 1011 | 1186 |
Quantitative status for groundwater
Table summarises the quantitative status of groundwater water bodies. These are classified as being at good or poor.
| Quantitative status | Poor | Good | Total |
|---|---|---|---|
| Number of water bodies | 0 | 0 | 0 |
| Number of water body elements | 0 | 0 | 0 |
Chemical status for groundwater
Table summarises the chemical status of groundwater water bodies. These are classified as being at good or poor.
| Chemical status | Poor | Good | Total |
|---|---|---|---|
| Number of water bodies | 0 | 0 | 0 |
| Number of water body elements | 0 | 0 | 0 |
Challenges data for Devon East Management Catchment
Reasons for not achieving good status by business sector
The issues preventing waters reaching good status and the sectors identified as contributing to them. The numbers in the table are individual counts of the reasons for not achieving good status with a confidence status of 'confirmed' and 'probable', where the latest classification is less than good status. There may be more than one reason in a single water body. Note, table does not include reasons for deterioration.
| Significant water management issue | Changes to the natural flow and level of water | Invasive non-native species | Physical modifications | Pollution from abandoned mines | Pollution from rural areas | Pollution from towns, cities and transport | Pollution from waste water |
|---|---|---|---|---|---|---|---|
| Agriculture and rural land management | 0 | 0 | 14 | 0 | 216 | 0 | 0 |
| Domestic general public | 0 | 0 | 0 | 0 | 0 | 5 | 0 |
| Industry | 0 | 0 | 0 | 0 | 0 | 5 | 0 |
| Local & central government | 0 | 0 | 4 | 0 | 0 | 0 | 0 |
| Mining and quarrying | 0 | 0 | 0 | 0 | 0 | 0 | 0 |
| Navigation | 0 | 0 | 0 | 0 | 0 | 0 | 0 |
| No sector responsible | 0 | 6 | 0 | 0 | 0 | 0 | 0 |
| Other | 2 | 0 | 4 | 0 | 0 | 2 | 0 |
| Recreation | 0 | 0 | 0 | 0 | 0 | 0 | 0 |
| Sector under investigation | 0 | 0 | 0 | 0 | 0 | 0 | 0 |
| Urban and transport | 0 | 0 | 1 | 0 | 0 | 6 | 0 |
| Waste treatment and disposal | 0 | 0 | 0 | 0 | 0 | 0 | 0 |
| Water Industry | 0 | 0 | 0 | 0 | 0 | 0 | 63 |
| Total | 2 | 6 | 23 | 0 | 216 | 18 | 63 |
Objectives data for Devon East Management Catchment
Ecological status or potential objectives for surface water bodies
Table summarises the ecological status and ecological potential objectives set for water bodies in the river basin management plan. Each water body is only counted once in this table. Each water body objective consists of a target status and a date when it was, or is expected to be, met.
| Status | Bad | Poor | Moderate | Good | High | Total |
|---|---|---|---|---|---|---|
| By 2015 | 0 | 0 | 0 | 13 | 0 | 13 |
| By 2021 | 0 | 0 | 0 | 1 | 0 | 1 |
| By 2027 | 0 | 1 | 0 | 68 | 0 | 69 |
| Total | 0 | 1 | 0 | 82 | 0 | 83 |
Chemical status objectives for surface water bodies
Including those with less stringent objectives and extended deadlines
| Status | Fail | Good | Total |
|---|---|---|---|
| By 2063 | 0 | 83 | 83 |
| Total | 0 | 83 | 83 |
Quantitative status objectives for groundwater
Including those with less stringent objectives and extended deadlines
| Status | Poor | Good | Total |
|---|---|---|---|
| Total | 0 | 0 | 0 |
Chemical status objectives for groundwater
Including those with less stringent objectives and extended deadlines
| Status | Poor | Good | Total |
|---|---|---|---|
| Total | 0 | 0 | 0 |