New Forest Management Catchment
About
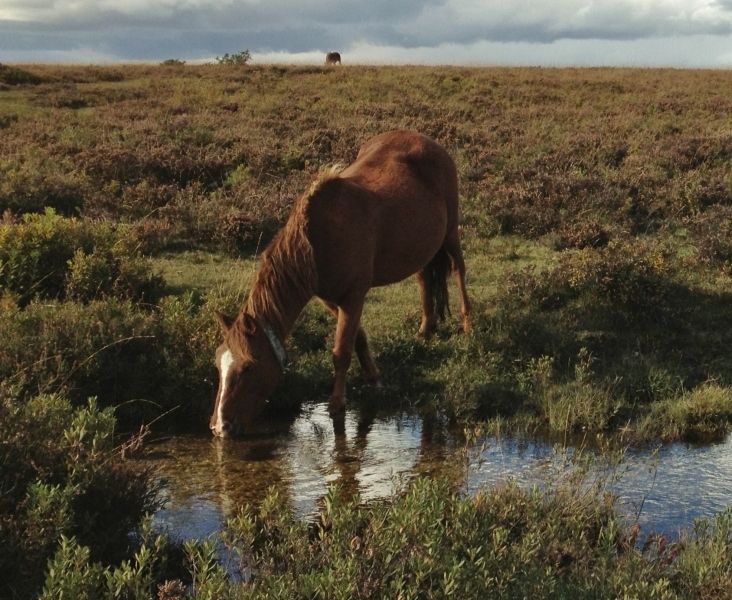
The New Forest catchment encompasses approximately 450 square kilometres and lies mostly within the New Forest National Park boundary. The area is largely rural, with several picturesque villages and the larger settlements of Lyndhurst and Brockenhurst. The main urban areas are confined to the waterside communities bordering Southampton Water and along the south west coastal zone. The population of the area swells in the summer with the influx of tourists. The New Forest is a unique landscape, consisting of ancient and ornamental woodland, areas of grassland known locally as lawns and the largest remaining area of heather covered lowland heath in Europe. It is famed for its free ranging New Forest ponies, cattle and pigs, managed traditionally over the centuries by an extensive grazing system and pastoral economy. Its numerous small streams, ponds, lakes, coastal mudflats and salt marshes provide rare habitats for wildlife which support many designated conservation sites. Whilst groundwater generally provides good quality baseflow, the network of rivers and ponds are primarily fed by rainfall, which has helped to create the Forests unique landscape and its diverse range of habitats. While the New Forest is valued for it natural rural landscape, its rivers have been managed and engineered over the years. Several have tidal controls, others are ponded and more have been dredged and straightened for land drainage and agriculture. Nevertheless, each river has its own unique environmental value and the New Forest has some of the most diverse ecology and valuable wetlands in lowland England.
Classifications data for New Forest Management Catchment
Number of water bodies
The number of water bodies in the river basin district. It shows whether these are natural, artificial (such as canals and reservoirs) or have been modified ('heavily modified') for particular uses.
| Water body categories | Natural | Artificial | Heavily modified | Total |
|---|---|---|---|---|
| River, canals and surface water transfers | 7 | 0 | 9 | 16 |
| Lake | 0 | 0 | 2 | 2 |
| Coastal | 0 | 0 | 0 | 0 |
| Estuarine | 0 | 0 | 0 | 0 |
| Groundwater | 0 | 0 | 0 | 0 |
| Total | 7 | 0 | 11 | 18 |
Ecological status for surface waters
Table summarises the current ecological status of surface water bodies. Water bodies are classified as being at high, good, moderate, poor or bad ecological status or potential.
| Ecological status or potential | Bad | Poor | Moderate | Good | High | Total |
|---|---|---|---|---|---|---|
| Number of water bodies | 0 | 1 | 14 | 3 | 0 | 18 |
| Number of water body elements | 0 | 5 | 13 | 24 | 121 | 163 |
Chemical status for surface waters
Table summarises the current chemical status of water bodies. These are classified as being at good or fail.
| Chemical status | Fail | Good | Total |
|---|---|---|---|
| Number of water bodies | 18 | 0 | 18 |
| Number of water body elements | 36 | 243 | 279 |
Quantitative status for groundwater
Table summarises the quantitative status of groundwater water bodies. These are classified as being at good or poor.
| Quantitative status | Poor | Good | Total |
|---|---|---|---|
| Number of water bodies | 0 | 0 | 0 |
| Number of water body elements | 0 | 0 | 0 |
Chemical status for groundwater
Table summarises the chemical status of groundwater water bodies. These are classified as being at good or poor.
| Chemical status | Poor | Good | Total |
|---|---|---|---|
| Number of water bodies | 0 | 0 | 0 |
| Number of water body elements | 0 | 0 | 0 |
Challenges data for New Forest Management Catchment
Reasons for not achieving good status by business sector
The issues preventing waters reaching good status and the sectors identified as contributing to them. The numbers in the table are individual counts of the reasons for not achieving good status with a confidence status of 'confirmed' and 'probable', where the latest classification is less than good status. There may be more than one reason in a single water body. Note, table does not include reasons for deterioration.
| Significant water management issue | Changes to the natural flow and level of water | Invasive non-native species | Physical modifications | Pollution from abandoned mines | Pollution from rural areas | Pollution from towns, cities and transport | Pollution from waste water |
|---|---|---|---|---|---|---|---|
| Agriculture and rural land management | 0 | 0 | 0 | 0 | 28 | 0 | 0 |
| Domestic general public | 0 | 0 | 0 | 0 | 0 | 5 | 1 |
| Industry | 0 | 0 | 0 | 0 | 0 | 0 | 0 |
| Local & central government | 0 | 0 | 3 | 0 | 0 | 0 | 0 |
| Mining and quarrying | 0 | 0 | 0 | 0 | 0 | 0 | 0 |
| Navigation | 0 | 0 | 0 | 0 | 0 | 0 | 0 |
| No sector responsible | 0 | 0 | 0 | 0 | 0 | 0 | 0 |
| Other | 0 | 0 | 0 | 0 | 0 | 0 | 0 |
| Recreation | 0 | 0 | 2 | 0 | 0 | 0 | 0 |
| Sector under investigation | 0 | 0 | 1 | 0 | 0 | 0 | 0 |
| Urban and transport | 0 | 0 | 2 | 0 | 0 | 4 | 0 |
| Waste treatment and disposal | 0 | 0 | 0 | 0 | 0 | 0 | 0 |
| Water Industry | 0 | 0 | 1 | 0 | 0 | 0 | 9 |
| Total | 0 | 0 | 9 | 0 | 28 | 9 | 10 |
Objectives data for New Forest Management Catchment
Ecological status or potential objectives for surface water bodies
Table summarises the ecological status and ecological potential objectives set for water bodies in the river basin management plan. Each water body is only counted once in this table. Each water body objective consists of a target status and a date when it was, or is expected to be, met.
| Status | Bad | Poor | Moderate | Good | High | Total |
|---|---|---|---|---|---|---|
| By 2015 | 0 | 0 | 3 | 4 | 0 | 7 |
| By 2021 | 0 | 0 | 0 | 3 | 0 | 3 |
| By 2027 | 0 | 0 | 1 | 7 | 0 | 8 |
| Total | 0 | 0 | 4 | 14 | 0 | 18 |
Chemical status objectives for surface water bodies
Including those with less stringent objectives and extended deadlines
| Status | Fail | Good | Total |
|---|---|---|---|
| By 2063 | 0 | 18 | 18 |
| Total | 0 | 18 | 18 |
Quantitative status objectives for groundwater
Including those with less stringent objectives and extended deadlines
| Status | Poor | Good | Total |
|---|---|---|---|
| Total | 0 | 0 | 0 |
Chemical status objectives for groundwater
Including those with less stringent objectives and extended deadlines
| Status | Poor | Good | Total |
|---|---|---|---|
| Total | 0 | 0 | 0 |