Loddon Operational Catchment
About
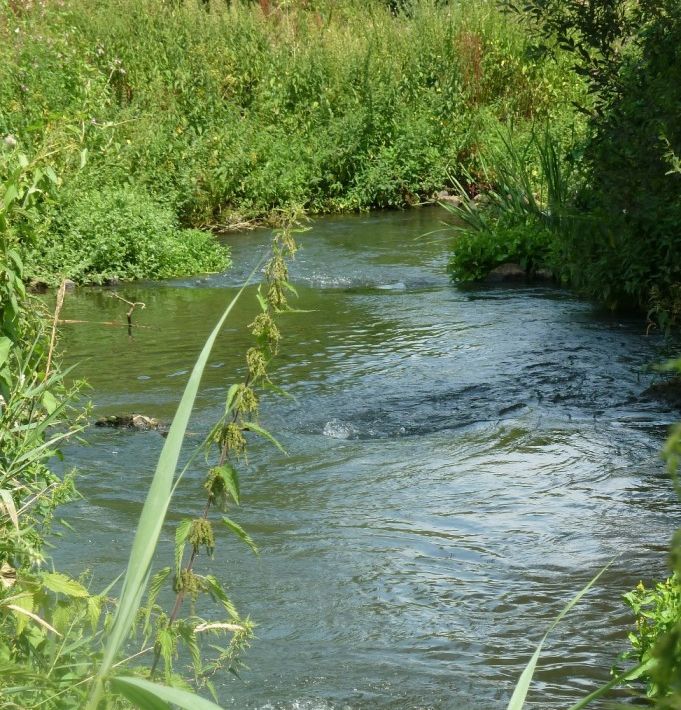
The Loddon catchment covers an area of 680km2 across Hampshire, Berkshire and Surrey. The River Loddon arises from chalk fed springs at Basingstoke, and flows north easterly over chalk and clay, joining the Thames just west of Wargrave. Much of the catchment is rural with urban and suburban development accounting for around 39% of the land area; the main urban centres being Basingstoke, the east of Reading, Bracknell, Wokingham and the Camberley-Farnborough-Aldershot conurbation.The Loddon and its tributaries provide a diverse range of habitats and support a range of protected species including otter which are starting to recolonise the catchment. The Loddon catchment supports a large urban population, as well as large tracts of arable land. Chalk streams (a priority habitat) are present in areas of the catchment. Native brown trout populations are found in the headwaters. Part of the river and the adjacent meadows near Stanfordend Mill are designated as a SSSI – the river for Loddon pondweed Potamogeton nodosus as the river is the principle location for this species in the UK, and the meadows for the fritillary Fritillaria meleagris. Our investigations programme shows that pollution from rural areas and waste water, physical modifications and changes to natural level and flow of water are some of the main challenges in the catchment. Physical habitat restoration is also needed at a number of locations to address the problems of past engineering and the impacts of control structures where these are severely limiting the ecological potential of the catchment.
Classifications data for Loddon Operational Catchment
Number of water bodies
The number of water bodies in the river basin district. It shows whether these are natural, artificial (such as canals and reservoirs) or have been modified ('heavily modified') for particular uses.
| Water body categories | Natural | Artificial | Heavily modified | Total |
|---|---|---|---|---|
| River, canals and surface water transfers | 16 | 0 | 3 | 19 |
| Lake | 0 | 1 | 2 | 3 |
| Coastal | 0 | 0 | 0 | 0 |
| Estuarine | 0 | 0 | 0 | 0 |
| Groundwater | 0 | 0 | 0 | 0 |
| Total | 16 | 1 | 5 | 22 |
Ecological status for surface waters
Table summarises the current ecological status of surface water bodies. Water bodies are classified as being at high, good, moderate, poor or bad ecological status or potential.
| Ecological status or potential | Bad | Poor | Moderate | Good | High | Total |
|---|---|---|---|---|---|---|
| Number of water bodies | 1 | 9 | 12 | 0 | 0 | 22 |
| Number of water body elements | 2 | 23 | 40 | 24 | 121 | 210 |
Chemical status for surface waters
Table summarises the current chemical status of water bodies. These are classified as being at good or fail.
| Chemical status | Fail | Good | Total |
|---|---|---|---|
| Number of water bodies | 22 | 0 | 22 |
| Number of water body elements | 38 | 296 | 334 |
Quantitative status for groundwater
Table summarises the quantitative status of groundwater water bodies. These are classified as being at good or poor.
| Quantitative status | Poor | Good | Total |
|---|---|---|---|
| Number of water bodies | 0 | 0 | 0 |
| Number of water body elements | 0 | 0 | 0 |
Chemical status for groundwater
Table summarises the chemical status of groundwater water bodies. These are classified as being at good or poor.
| Chemical status | Poor | Good | Total |
|---|---|---|---|
| Number of water bodies | 0 | 0 | 0 |
| Number of water body elements | 0 | 0 | 0 |
Challenges data for Loddon Operational Catchment
Reasons for not achieving good status by business sector
The issues preventing waters reaching good status and the sectors identified as contributing to them. The numbers in the table are individual counts of the reasons for not achieving good status with a confidence status of 'confirmed' and 'probable', where the latest classification is less than good status. There may be more than one reason in a single water body. Note, table does not include reasons for deterioration.
| Significant water management issue | Changes to the natural flow and level of water | Invasive non-native species | Physical modifications | Pollution from abandoned mines | Pollution from rural areas | Pollution from towns, cities and transport | Pollution from waste water |
|---|---|---|---|---|---|---|---|
| Agriculture and rural land management | 0 | 0 | 3 | 0 | 4 | 0 | 0 |
| Domestic general public | 0 | 0 | 0 | 0 | 0 | 0 | 0 |
| Industry | 0 | 0 | 0 | 0 | 0 | 1 | 0 |
| Local & central government | 0 | 0 | 1 | 0 | 0 | 0 | 0 |
| Mining and quarrying | 0 | 0 | 0 | 0 | 0 | 0 | 0 |
| Navigation | 0 | 0 | 0 | 0 | 0 | 0 | 0 |
| No sector responsible | 0 | 1 | 0 | 0 | 0 | 0 | 0 |
| Other | 0 | 0 | 11 | 0 | 0 | 0 | 0 |
| Recreation | 0 | 0 | 3 | 0 | 0 | 0 | 0 |
| Sector under investigation | 0 | 0 | 0 | 0 | 0 | 0 | 0 |
| Urban and transport | 0 | 0 | 14 | 0 | 0 | 7 | 0 |
| Waste treatment and disposal | 0 | 0 | 0 | 0 | 0 | 0 | 0 |
| Water Industry | 2 | 0 | 0 | 0 | 0 | 0 | 33 |
| Total | 2 | 1 | 32 | 0 | 4 | 8 | 33 |
Objectives data for Loddon Operational Catchment
Ecological status or potential objectives for surface water bodies
Table summarises the ecological status and ecological potential objectives set for water bodies in the river basin management plan. Each water body is only counted once in this table. Each water body objective consists of a target status and a date when it was, or is expected to be, met.
| Status | Bad | Poor | Moderate | Good | High | Total |
|---|---|---|---|---|---|---|
| By 2015 | 0 | 0 | 8 | 0 | 0 | 8 |
| By 2021 | 0 | 0 | 1 | 0 | 0 | 1 |
| By 2027 | 0 | 0 | 0 | 12 | 0 | 12 |
| By 2033 | 0 | 0 | 0 | 1 | 0 | 1 |
| Total | 0 | 0 | 9 | 13 | 0 | 22 |
Chemical status objectives for surface water bodies
Including those with less stringent objectives and extended deadlines
| Status | Fail | Good | Total |
|---|---|---|---|
| By 2063 | 0 | 22 | 22 |
| Total | 0 | 22 | 22 |
Quantitative status objectives for groundwater
Including those with less stringent objectives and extended deadlines
| Status | Poor | Good | Total |
|---|---|---|---|
| Total | 0 | 0 | 0 |
Chemical status objectives for groundwater
Including those with less stringent objectives and extended deadlines
| Status | Poor | Good | Total |
|---|---|---|---|
| Total | 0 | 0 | 0 |