North Cornwall Seaton Looe and Fowey Management Catchment
About
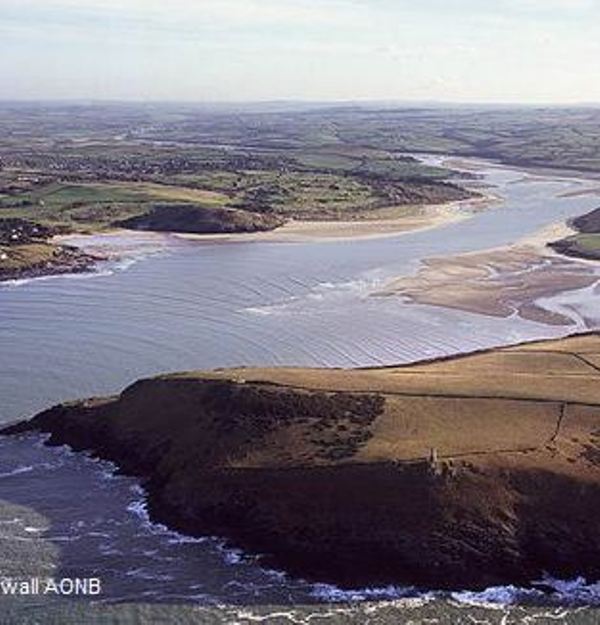
The North Cornwall, Seaton, Looe and Fowey management catchment is situated entirely within Cornwall. It includes stretches of the north and south coast as well as much of central and eastern inland Cornwall. The catchment includes rivers draining to both the north and south coast. The most notable are the Camel, which flows within the northern part of the catchment before forming the Camel estuary downstream of Wadebridge, and the Fowey, which flows in a southerly direction from Bodmin Moor before finally reaching the sea at the coastal town of Fowey. Smaller rivers draining to the north coast include the Gannel in the west and Strat / Neet in the north east, while the south coast features the rivers Looe and Seaton.The landscape within the management catchment is hugely varied, from sandy coastal beaches and the Camel estuary on the coast to the rugged uplands of Bodmin Moor. Rolling farmland and wooded river valleys also feature across the catchment. The area is predominantly rural with agriculture the dominant land use. The main inland town is Bodmin, while on the coast settlements within the catchment include Newquay, Padstow, Bude, Looe and Fowey. Tourism is valuable to the area, with coastal towns in particular seeing an influx of visitors at key times each year. There are a number of designated areas within the management catchment. Inland the River Camel and Crowdy Marsh are both Special Areas of Conservation (SAC), while the Cornwall Area of Outstanding Natural Beauty (AONB) covers parts of both coastline and Bodmin Moor. Sites of Special Scientific Interest cover a notable area within the management catchment, with a large swathe of Bodmin Moor and River Camel valley both designated. Bathing water areas are present on both coastlines.
Classifications data for North Cornwall Seaton Looe and Fowey Management Catchment
Number of water bodies
The number of water bodies in the river basin district. It shows whether these are natural, artificial (such as canals and reservoirs) or have been modified ('heavily modified') for particular uses.
| Water body categories | Natural | Artificial | Heavily modified | Total |
|---|---|---|---|---|
| River, canals and surface water transfers | 42 | 0 | 3 | 45 |
| Lake | 1 | 0 | 4 | 5 |
| Coastal | 0 | 0 | 0 | 0 |
| Estuarine | 0 | 0 | 0 | 0 |
| Groundwater | 0 | 0 | 0 | 0 |
| Total | 43 | 0 | 7 | 50 |
Ecological status for surface waters
Table summarises the current ecological status of surface water bodies. Water bodies are classified as being at high, good, moderate, poor or bad ecological status or potential.
| Ecological status or potential | Bad | Poor | Moderate | Good | High | Total |
|---|---|---|---|---|---|---|
| Number of water bodies | 0 | 10 | 24 | 15 | 0 | 49 |
| Number of water body elements | 1 | 13 | 43 | 75 | 333 | 465 |
Chemical status for surface waters
Table summarises the current chemical status of water bodies. These are classified as being at good or fail.
| Chemical status | Fail | Good | Total |
|---|---|---|---|
| Number of water bodies | 49 | 0 | 49 |
| Number of water body elements | 104 | 528 | 632 |
Quantitative status for groundwater
Table summarises the quantitative status of groundwater water bodies. These are classified as being at good or poor.
| Quantitative status | Poor | Good | Total |
|---|---|---|---|
| Number of water bodies | 0 | 0 | 0 |
| Number of water body elements | 0 | 0 | 0 |
Chemical status for groundwater
Table summarises the chemical status of groundwater water bodies. These are classified as being at good or poor.
| Chemical status | Poor | Good | Total |
|---|---|---|---|
| Number of water bodies | 0 | 0 | 0 |
| Number of water body elements | 0 | 0 | 0 |
Challenges data for North Cornwall Seaton Looe and Fowey Management Catchment
Reasons for not achieving good status by business sector
The issues preventing waters reaching good status and the sectors identified as contributing to them. The numbers in the table are individual counts of the reasons for not achieving good status with a confidence status of 'confirmed' and 'probable', where the latest classification is less than good status. There may be more than one reason in a single water body. Note, table does not include reasons for deterioration.
| Significant water management issue | Changes to the natural flow and level of water | Invasive non-native species | Physical modifications | Pollution from abandoned mines | Pollution from rural areas | Pollution from towns, cities and transport | Pollution from waste water |
|---|---|---|---|---|---|---|---|
| Agriculture and rural land management | 2 | 0 | 3 | 0 | 50 | 0 | 0 |
| Domestic general public | 0 | 0 | 0 | 0 | 0 | 4 | 1 |
| Industry | 0 | 0 | 0 | 0 | 0 | 2 | 0 |
| Local & central government | 0 | 0 | 2 | 0 | 0 | 0 | 0 |
| Mining and quarrying | 0 | 0 | 0 | 17 | 0 | 0 | 0 |
| Navigation | 0 | 0 | 2 | 0 | 0 | 0 | 0 |
| No sector responsible | 0 | 0 | 1 | 0 | 0 | 0 | 0 |
| Other | 2 | 0 | 2 | 0 | 0 | 0 | 0 |
| Recreation | 0 | 0 | 1 | 0 | 0 | 0 | 0 |
| Sector under investigation | 0 | 0 | 0 | 0 | 0 | 0 | 0 |
| Urban and transport | 0 | 0 | 2 | 0 | 0 | 0 | 0 |
| Waste treatment and disposal | 0 | 0 | 0 | 0 | 0 | 0 | 0 |
| Water Industry | 1 | 0 | 6 | 0 | 0 | 0 | 14 |
| Total | 5 | 0 | 19 | 17 | 50 | 6 | 15 |
Objectives data for North Cornwall Seaton Looe and Fowey Management Catchment
Ecological status or potential objectives for surface water bodies
Table summarises the ecological status and ecological potential objectives set for water bodies in the river basin management plan. Each water body is only counted once in this table. Each water body objective consists of a target status and a date when it was, or is expected to be, met.
| Status | Bad | Poor | Moderate | Good | High | Total |
|---|---|---|---|---|---|---|
| By 2015 | 0 | 0 | 0 | 15 | 0 | 15 |
| By 2021 | 0 | 1 | 2 | 2 | 0 | 5 |
| By 2027 | 0 | 0 | 0 | 29 | 0 | 29 |
| Total | 0 | 1 | 2 | 46 | 0 | 49 |
Chemical status objectives for surface water bodies
Including those with less stringent objectives and extended deadlines
| Status | Fail | Good | Total |
|---|---|---|---|
| By 2063 | 0 | 49 | 49 |
| Total | 0 | 49 | 49 |
Quantitative status objectives for groundwater
Including those with less stringent objectives and extended deadlines
| Status | Poor | Good | Total |
|---|---|---|---|
| Total | 0 | 0 | 0 |
Chemical status objectives for groundwater
Including those with less stringent objectives and extended deadlines
| Status | Poor | Good | Total |
|---|---|---|---|
| Total | 0 | 0 | 0 |
Summary Statistics data for North Cornwall Seaton Looe and Fowey Management Catchment
Ecological status and potential
| Summary statistic | Rivers, Canals and SWTs | Lakes | Estuaries | Coastal | Surface Waters Combined |
|---|---|---|---|---|---|
| % of water bodies at good or better ecological status/potential | 31% | 25% | 31% | ||
| % of biological elements, phys-chem elements and specific pollutants at good or better status | 88% | 74% | 87% | ||
| % of water bodies with an objective of good ecological status/potential or better | 93% | 80% | 92% | ||
| % of biological elements, phys-chem elements and Specific Pollutants with an objective of good status or better | 98% | 97% | 98% |
Chemical
| Summary statistic | Rivers, Canals and SWTs | Lakes | Estuaries | Coastal | Surface Waters Combined |
|---|---|---|---|---|---|
| % of water bodies at good chemical status | 0% | 0% | 0% | ||
| % of chemical elements at good status | 83% | 88% | 84% | ||
| % of water bodies at good chemical status without uPBT | 96% | 100% | 96% | ||
| % of chemical elements at good status without uPBT | 98% | 100% | 99% | ||
| % of water bodies with an objective of good chemical status | 100% | 80% | 98% | ||
| % of chemical elements with an objective of good | 100% | 100% | 100% | ||
| % of water bodies with an objective of good chemical status without uPBT | 100% | 100% | 100% | ||
| % of chemical elements with an objective of good without uPBTs | 100% | 100% | 100% |