We use essential cookies to give you the best online
experience. Without them, this service will not work. We also use
non-essential cookies to analyse site usage to continually improve the
services we provide you with. Full details of cookies collected,
and the functionality to change your cookie preference at any time can be
accessed on our Cookie Policy Page.
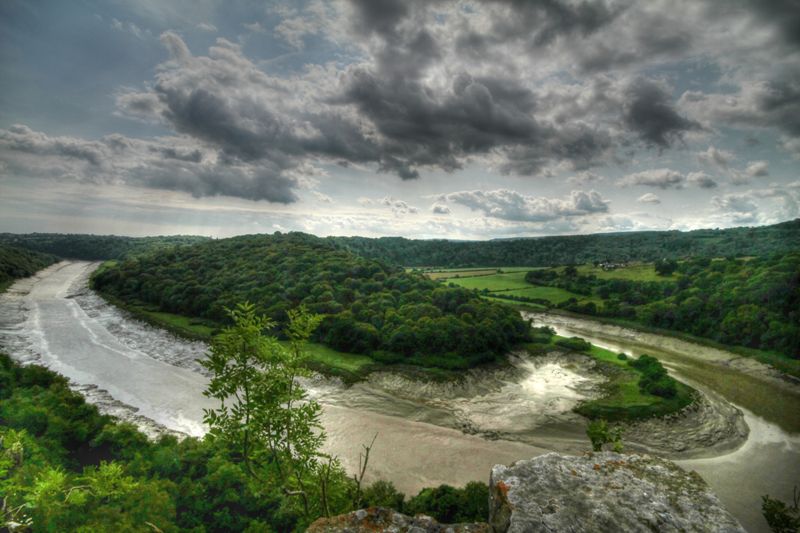
The Severn river basin district, which covers over 21,000km2 lies both in England and Wales. It extends from the Welsh uplands, through the rolling hills of the Midlands and south to the Severn Estuary.
In total over 5 million people live and work in the region and, although predominantly rural, it includes urban areas such as Bristol, Coventry, Cardiff, the South Wales Valleys and parts of the West Midlands conurbation.
The Severn river basin district has a particularly rich diversity of wildlife and habitats, supporting many species of global and national importance. For example, the Severn Estuary and its surrounding area are protected for their bird populations, habitats and migratory fish species such as Atlantic salmon, shad, lamprey and eel.
The management catchments that make up the river basin district range from energetic upland streams to slower rivers in the lowlands, and include sandstone and limestone aquifers used for public water supply in the Midlands.
Around 80% of the river basin district land is used for agriculture and forestry, which shapes much of the landscape. The sector includes beef and sheep farming, large-scale dairy farms, coniferous forestry plantations and some arable and specialist horticulture. The economy of the district is supported by business, transport, health, tourism and recreation as well as manufacturing, mineral industries and the operation of commercial ports.
Classifications data for Severn River Basin District
Number of water bodies
The number of water bodies in the river basin district. It shows
whether these are natural, artificial (such as canals and reservoirs) or
have been modified ('heavily modified') for particular uses.
Water body categories
Natural
Artificial
Heavily modified
Total
River, canals and surface water transfers
358
36
51
445
Lake
10
7
10
27
Coastal
0
0
0
0
Estuarine
0
0
3
3
Groundwater
33
0
0
33
Total
401
43
64
508
Ecological status for surface waters
Table summarises the current ecological status
of surface water bodies. Water bodies are
classified as being at high, good, moderate, poor
or bad ecological status or potential.
Ecological status or potential
Bad
Poor
Moderate
Good
High
Total
Number of water bodies
11
110
309
45
0
475
Number of water body elements
39
337
561
518
2778
4233
Chemical status for surface waters
Table summarises the current chemical status of
water bodies. These are classified as being at
good or fail.
Table summarises the quantitative status of
groundwater water bodies. These are classified as
being at good or poor.
Quantitative status
Poor
Good
Total
Number of water bodies
9
24
33
Number of water body elements
14
118
132
Chemical status for groundwater
Table summarises the chemical status of
groundwater water bodies. These are classified as
being at good or poor.
Chemical status
Poor
Good
Total
Number of water bodies
12
21
33
Number of water body elements
21
144
165
Challenges data for Severn River Basin District
Reasons for not achieving good status by business sector
The issues preventing waters reaching good status and the sectors
identified as contributing to them. The numbers in the table are
individual counts of the reasons for not achieving good status with a
confidence status of 'confirmed' and 'probable', where the latest
classification is less than good status. There may be more than one
reason in a single water body. Note, table does not include reasons for
deterioration.
Significant water management issue
Changes to the natural flow and level of water
Invasive non-native species
Physical modifications
Pollution from abandoned mines
Pollution from rural areas
Pollution from towns, cities and transport
Pollution from waste water
Agriculture and rural land management
12
0
48
0
889
0
1
Domestic general public
0
0
0
0
0
41
5
Industry
5
0
12
0
0
22
5
Local & central government
0
0
46
0
0
0
0
Mining and quarrying
0
0
1
16
0
0
0
Navigation
2
0
7
0
0
0
0
No sector responsible
0
5
0
0
0
0
0
Other
2
0
31
2
0
0
0
Recreation
0
0
6
0
0
0
0
Sector under investigation
4
0
16
0
0
1
0
Urban and transport
0
0
55
0
0
105
3
Waste treatment and disposal
0
0
0
0
0
1
1
Water Industry
56
0
9
0
0
3
328
Total
81
5
231
18
889
173
343
Objectives data for Severn River Basin District
Ecological status or potential objectives for surface water bodies
Table summarises the ecological status and ecological potential
objectives set for water bodies in the river basin management
plan. Each water body is only counted once in this table. Each water
body objective consists of a target status and a date when it was, or
is expected to be, met.
Status
Bad
Poor
Moderate
Good
High
Total
By 2015
0
4
54
49
0
107
By 2021
0
0
3
17
0
20
By 2027
0
0
16
328
0
344
By 2033
0
0
0
4
0
4
Total
0
4
73
398
0
475
Chemical status objectives for surface water bodies
Including those with less stringent objectives and extended deadlines
Status
Fail
Good
Total
By 2063
0
475
475
Total
0
475
475
Quantitative status objectives for groundwater
Including those with less stringent objectives and extended deadlines
Status
Poor
Good
Total
By 2015
6
22
28
By 2021
0
2
2
By 2027
0
3
3
Total
6
27
33
Chemical status objectives for groundwater
Including those with less stringent objectives and extended deadlines
Status
Poor
Good
Total
By 2015
1
17
18
By 2021
0
3
3
By 2027
0
9
9
By 2050
0
3
3
Total
1
32
33
Protected Areas data for Severn River Basin District
Drinking water protected areas current status and at risk
Water body type
Number of drinking water protected areas
Number ‘at risk’
Number at poor chemical status for drinking water protected area objectives
Surface water
22
13
Does not apply to surface waters
Groundwater
33
17
8
Shellfish water protected areas current status and objectives
No data to show
Bathing water protected areas current status and objectives
Number of bathing waters
Objective
Number which met at least the sufficient classification in 2021
Number expected to achieve at least sufficient in 2022
Number at risk of not achieving sufficient in 2022
4
At least sufficient classification
4
2
2
There are 0 unassessed bathing waters
Nutrient sensitive areas (nitrate vulnerable zones)
Reason for designation
Number of NVZs
Land area (ha) covered by NVZ type
% of river basin district covered by NVZ type
High nitrates in surface waters
66
688,722
49
Eutrophication in lakes or reservoirs
11
21,781
2
High nitrates in groundwater
22
318,317
23
Nutrient sensitive areas (Urban Waste Water Treatment Regulations)
Reason for designation
Number of Sensitive areas
Length (KM)/Area (km2) designated
Eutrophication in rivers
20
816
Eutrophication in canals
2
63.00
High nitrate in surface fresh water
2
30.00
Eutrophication in lakes or reservoirs
2
3.10
Habitats site (European site) protected areas*
Site type
Number of sites
Ramsar Site
4
Special Area of Conservation
10
Special Protection Area
3
Condition of underlying water-dependent Site of Special Scientific
Interest units**
*Ramsar sites are not protected areas under the Water Environment (Water Framework Directive) Regulations 2017. However they are treated in line with Special Areas of Conservation (SAC) and Special Protection Areas (SPA) as a matter of Government policy. Most Ramsar sites coincide with SACs and/or SPAs, but a small number are designated as Ramsar sites only. These are included in the water-dependent site condition data.
**Includes SSSI units underlying European sites and Ramsar sites where the habitat is water-dependent. The "RBMP-favourable" category in these tables includes units where any reasons for not being in "favourable condition", as far as can be ascertained, do not relate to the water-dependent features. As a result, all condition categories have the prefix "RBMP" to distinguish these from conventional SSSI condition reporting, in which pressures not relevant to river basin planning are included in determining site condition. Data retrieved 2019. Methodology changes mean this data does not form a continuous series with data reported in 2015.
Summary Statistics data for Severn River Basin District
Ecological status and potential
Summary statistic
Rivers, Canals and SWTs
Lakes
Estuaries
Coastal
Surface Waters Combined
% of water bodies at good or better ecological status/potential
9%
11%
0%
9%
% of biological elements, phys-chem elements and specific pollutants at good or better status
77%
48%
91%
76%
% of water bodies with an objective of good ecological status/potential or better
84%
70%
100%
84%
% of biological elements, phys-chem elements and Specific Pollutants with an objective of good status or better
97%
92%
100%
97%
Chemical
Summary statistic
Rivers, Canals and SWTs
Lakes
Estuaries
Coastal
Surface Waters Combined
% of water bodies at good chemical status
0%
0%
0%
0%
% of chemical elements at good status
82%
81%
87%
82%
% of water bodies at good chemical status without uPBT
98%
100%
67%
97%
% of chemical elements at good status without uPBT
Greater than 99%
100%
99%
Greater than 99%
% of water bodies with an objective of good chemical status
100%
100%
100%
100%
% of chemical elements with an objective of good
100%
100%
100%
100%
% of water bodies with an objective of good chemical status without uPBT
100%
100%
100%
100%
% of chemical elements with an objective of good without uPBTs
100%
100%
100%
100%
Groundwater
Summary statistic
Ground water
% of water bodies at good chemical (GW) status
64%
% of groundwater chemical elements at good status
87%
% of water bodies with an objective of good chemical (GW) status
97%
% of groundwater chemical elements with an objective of good
Greater than 99%
% of water bodies at good quantitative status
73%
% of groundwater quantitative elements at good status
89%
% of water bodies with an objective of good quantitative status
82%
% of groundwater quantitative elements with an objective of good