Avon Warwickshire Management Catchment
About
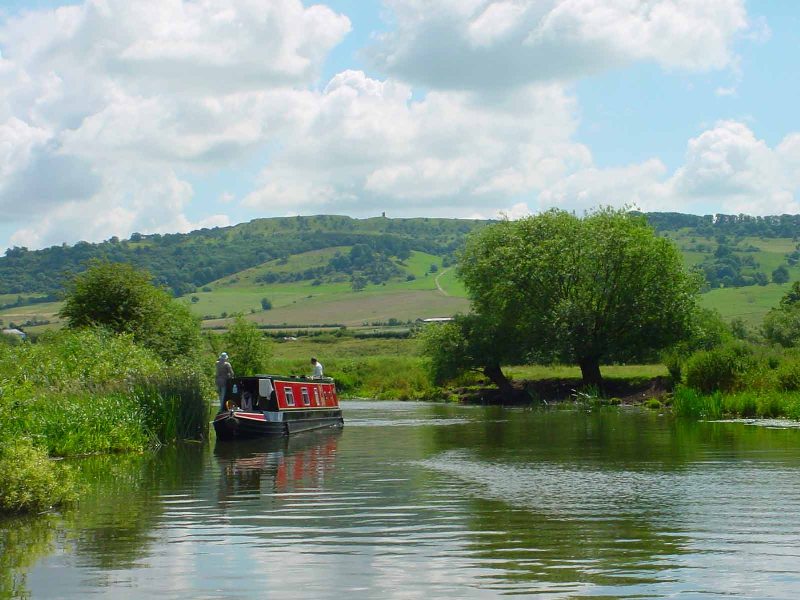
The Warwickshire Avon catchment extends from the source of the River Avon near Coventry to its confluence with the River Severn near Tewkesbury and includes tributaries such as the rivers Arrow, Swift, Leam and Stour. It is a largely rural catchment with some urban conurbations, notably Coventry, Warwick, Stratford-upon-Avon, Evesham, and Redditch. Agriculture accounts for a high proportion of the land use including arable, livestock, horticulture, and market gardening around Evesham. The catchment has a high value for wildlife and the area provides a variety of recreational activities, for example, the River Avon is navigable and a major resource for recreational activities such as boating, canoeing, fishing and walking, parts of the River Stour are located within the Cotswolds, which is popular with walkers, the Arrow catchment is important for anglers and water sports, and Stratford on Avon is a major tourist centre.
Classifications data for Avon Warwickshire Management Catchment
Number of water bodies
The number of water bodies in the river basin district. It shows whether these are natural, artificial (such as canals and reservoirs) or have been modified ('heavily modified') for particular uses.
| Water body categories | Natural | Artificial | Heavily modified | Total |
|---|---|---|---|---|
| River, canals and surface water transfers | 68 | 0 | 7 | 75 |
| Lake | 0 | 1 | 2 | 3 |
| Coastal | 0 | 0 | 0 | 0 |
| Estuarine | 0 | 0 | 0 | 0 |
| Groundwater | 0 | 0 | 0 | 0 |
| Total | 68 | 1 | 9 | 78 |
Ecological status for surface waters
Table summarises the current ecological status of surface water bodies. Water bodies are classified as being at high, good, moderate, poor or bad ecological status or potential.
| Ecological status or potential | Bad | Poor | Moderate | Good | High | Total |
|---|---|---|---|---|---|---|
| Number of water bodies | 1 | 22 | 54 | 1 | 0 | 78 |
| Number of water body elements | 5 | 84 | 96 | 95 | 461 | 741 |
Chemical status for surface waters
Table summarises the current chemical status of water bodies. These are classified as being at good or fail.
| Chemical status | Fail | Good | Total |
|---|---|---|---|
| Number of water bodies | 78 | 0 | 78 |
| Number of water body elements | 226 | 822 | 1048 |
Quantitative status for groundwater
Table summarises the quantitative status of groundwater water bodies. These are classified as being at good or poor.
| Quantitative status | Poor | Good | Total |
|---|---|---|---|
| Number of water bodies | 0 | 0 | 0 |
| Number of water body elements | 0 | 0 | 0 |
Chemical status for groundwater
Table summarises the chemical status of groundwater water bodies. These are classified as being at good or poor.
| Chemical status | Poor | Good | Total |
|---|---|---|---|
| Number of water bodies | 0 | 0 | 0 |
| Number of water body elements | 0 | 0 | 0 |
Challenges data for Avon Warwickshire Management Catchment
Reasons for not achieving good status by business sector
The issues preventing waters reaching good status and the sectors identified as contributing to them. The numbers in the table are individual counts of the reasons for not achieving good status with a confidence status of 'confirmed' and 'probable', where the latest classification is less than good status. There may be more than one reason in a single water body. Note, table does not include reasons for deterioration.
| Significant water management issue | Changes to the natural flow and level of water | Invasive non-native species | Physical modifications | Pollution from abandoned mines | Pollution from rural areas | Pollution from towns, cities and transport | Pollution from waste water |
|---|---|---|---|---|---|---|---|
| Agriculture and rural land management | 0 | 0 | 7 | 0 | 162 | 0 | 0 |
| Domestic general public | 0 | 0 | 0 | 0 | 0 | 12 | 0 |
| Industry | 0 | 0 | 2 | 0 | 0 | 4 | 3 |
| Local & central government | 0 | 0 | 6 | 0 | 0 | 0 | 0 |
| Mining and quarrying | 0 | 0 | 0 | 0 | 0 | 0 | 0 |
| Navigation | 1 | 0 | 1 | 0 | 0 | 0 | 0 |
| No sector responsible | 0 | 0 | 0 | 0 | 0 | 0 | 0 |
| Other | 0 | 0 | 1 | 0 | 0 | 0 | 0 |
| Recreation | 0 | 0 | 0 | 0 | 0 | 0 | 0 |
| Sector under investigation | 0 | 0 | 0 | 0 | 0 | 0 | 0 |
| Urban and transport | 0 | 0 | 10 | 0 | 0 | 32 | 0 |
| Waste treatment and disposal | 0 | 0 | 0 | 0 | 0 | 0 | 0 |
| Water Industry | 6 | 0 | 2 | 0 | 0 | 0 | 65 |
| Total | 7 | 0 | 29 | 0 | 162 | 48 | 68 |
Objectives data for Avon Warwickshire Management Catchment
Ecological status or potential objectives for surface water bodies
Table summarises the ecological status and ecological potential objectives set for water bodies in the river basin management plan. Each water body is only counted once in this table. Each water body objective consists of a target status and a date when it was, or is expected to be, met.
| Status | Bad | Poor | Moderate | Good | High | Total |
|---|---|---|---|---|---|---|
| By 2015 | 0 | 1 | 17 | 0 | 0 | 18 |
| By 2027 | 0 | 0 | 4 | 56 | 0 | 60 |
| Total | 0 | 1 | 21 | 56 | 0 | 78 |
Chemical status objectives for surface water bodies
Including those with less stringent objectives and extended deadlines
| Status | Fail | Good | Total |
|---|---|---|---|
| By 2063 | 0 | 78 | 78 |
| Total | 0 | 78 | 78 |
Quantitative status objectives for groundwater
Including those with less stringent objectives and extended deadlines
| Status | Poor | Good | Total |
|---|---|---|---|
| Total | 0 | 0 | 0 |
Chemical status objectives for groundwater
Including those with less stringent objectives and extended deadlines
| Status | Poor | Good | Total |
|---|---|---|---|
| Total | 0 | 0 | 0 |