Derwent North West Management Catchment
About
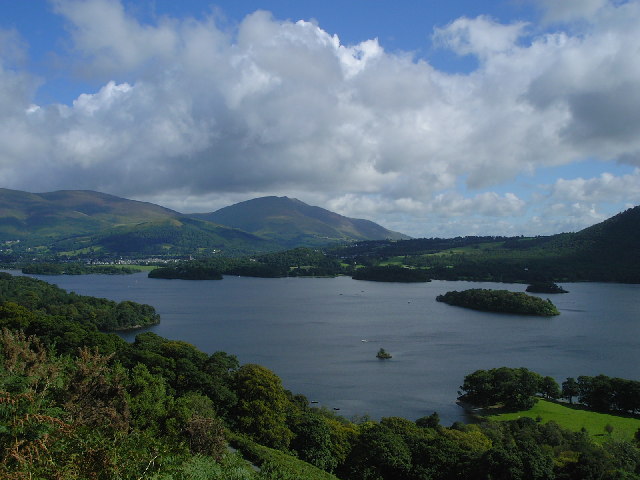
The Derwent catchment rises in the north-western fells of the Lake District National Park, with the River Derwents many tributaries and the River Cocker draining some of Englands highest fells including Blencathra and Skiddaw, before entering the Irish Sea at the industrial town of Workington. The River Ellen sub-catchment is a distinct drainage area to the north of this, fed by Overwater and Chapelhouse reservoir, before flowing by the small town of Aspatria to the Irish Sea at Maryport. The catchment includes many iconic lakes such as Bassenthwaite Lake, Derwent Water, Buttermere and Crummock Water, as well as Thirlmere a major public water supply for northwest England. There are several designated conservation areas including the River Derwent and tributaries Special Area of Conservation, and bathing waters and shellfish waters along the west Cumbrian coast. Key species include Atlantic salmon, Sea trout and native White-clawed crayfish. Land use is dominated by sheep and beef farming in the upper sub-catchments, with small to medium sized dairy farms in the lower sub-catchments. Nutrient enrichment of rivers and lakes results from waste water discharges and diffuse rural pollution and there is a legacy left by historic metal mine activities throughout the catchment which continues to cause environmental harm. The catchment suffers from flood risk in its key population centres due to the flashy nature of the rivers which rise and fall very quickly, with several flood defence schemes in place. The vibrant tourist industry is centred on the town of Keswick.
Classifications data for Derwent North West Management Catchment
Number of water bodies
The number of water bodies in the river basin district. It shows whether these are natural, artificial (such as canals and reservoirs) or have been modified ('heavily modified') for particular uses.
| Water body categories | Natural | Artificial | Heavily modified | Total |
|---|---|---|---|---|
| River, canals and surface water transfers | 26 | 0 | 6 | 32 |
| Lake | 6 | 0 | 5 | 11 |
| Coastal | 0 | 0 | 0 | 0 |
| Estuarine | 0 | 0 | 0 | 0 |
| Groundwater | 0 | 0 | 0 | 0 |
| Total | 32 | 0 | 11 | 43 |
Ecological status for surface waters
Table summarises the current ecological status of surface water bodies. Water bodies are classified as being at high, good, moderate, poor or bad ecological status or potential.
| Ecological status or potential | Bad | Poor | Moderate | Good | High | Total |
|---|---|---|---|---|---|---|
| Number of water bodies | 0 | 2 | 20 | 21 | 0 | 43 |
| Number of water body elements | 2 | 5 | 25 | 83 | 371 | 486 |
Chemical status for surface waters
Table summarises the current chemical status of water bodies. These are classified as being at good or fail.
| Chemical status | Fail | Good | Total |
|---|---|---|---|
| Number of water bodies | 43 | 0 | 43 |
| Number of water body elements | 95 | 674 | 769 |
Quantitative status for groundwater
Table summarises the quantitative status of groundwater water bodies. These are classified as being at good or poor.
| Quantitative status | Poor | Good | Total |
|---|---|---|---|
| Number of water bodies | 0 | 0 | 0 |
| Number of water body elements | 0 | 0 | 0 |
Chemical status for groundwater
Table summarises the chemical status of groundwater water bodies. These are classified as being at good or poor.
| Chemical status | Poor | Good | Total |
|---|---|---|---|
| Number of water bodies | 0 | 0 | 0 |
| Number of water body elements | 0 | 0 | 0 |
Challenges data for Derwent North West Management Catchment
Reasons for not achieving good status by business sector
The issues preventing waters reaching good status and the sectors identified as contributing to them. The numbers in the table are individual counts of the reasons for not achieving good status with a confidence status of 'confirmed' and 'probable', where the latest classification is less than good status. There may be more than one reason in a single water body. Note, table does not include reasons for deterioration.
| Significant water management issue | Changes to the natural flow and level of water | Invasive non-native species | Physical modifications | Pollution from abandoned mines | Pollution from rural areas | Pollution from towns, cities and transport | Pollution from waste water |
|---|---|---|---|---|---|---|---|
| Agriculture and rural land management | 0 | 0 | 2 | 0 | 10 | 0 | 0 |
| Domestic general public | 0 | 0 | 0 | 0 | 0 | 3 | 0 |
| Industry | 0 | 0 | 0 | 0 | 0 | 0 | 0 |
| Local & central government | 0 | 0 | 1 | 0 | 0 | 0 | 0 |
| Mining and quarrying | 0 | 0 | 0 | 6 | 0 | 0 | 0 |
| Navigation | 0 | 0 | 0 | 0 | 0 | 0 | 0 |
| No sector responsible | 0 | 0 | 0 | 0 | 0 | 0 | 0 |
| Other | 0 | 0 | 0 | 0 | 0 | 0 | 0 |
| Recreation | 0 | 0 | 0 | 0 | 0 | 0 | 0 |
| Sector under investigation | 0 | 0 | 5 | 0 | 0 | 0 | 0 |
| Urban and transport | 0 | 0 | 1 | 0 | 0 | 2 | 0 |
| Waste treatment and disposal | 0 | 0 | 0 | 0 | 0 | 0 | 0 |
| Water Industry | 2 | 0 | 3 | 0 | 0 | 0 | 3 |
| Total | 2 | 0 | 12 | 6 | 10 | 5 | 3 |
Objectives data for Derwent North West Management Catchment
Ecological status or potential objectives for surface water bodies
Table summarises the ecological status and ecological potential objectives set for water bodies in the river basin management plan. Each water body is only counted once in this table. Each water body objective consists of a target status and a date when it was, or is expected to be, met.
| Status | Bad | Poor | Moderate | Good | High | Total |
|---|---|---|---|---|---|---|
| By 2015 | 0 | 0 | 0 | 19 | 0 | 19 |
| By 2021 | 0 | 0 | 0 | 4 | 0 | 4 |
| By 2027 | 0 | 0 | 0 | 20 | 0 | 20 |
| Total | 0 | 0 | 0 | 43 | 0 | 43 |
Chemical status objectives for surface water bodies
Including those with less stringent objectives and extended deadlines
| Status | Fail | Good | Total |
|---|---|---|---|
| By 2063 | 0 | 43 | 43 |
| Total | 0 | 43 | 43 |
Quantitative status objectives for groundwater
Including those with less stringent objectives and extended deadlines
| Status | Poor | Good | Total |
|---|---|---|---|
| Total | 0 | 0 | 0 |
Chemical status objectives for groundwater
Including those with less stringent objectives and extended deadlines
| Status | Poor | Good | Total |
|---|---|---|---|
| Total | 0 | 0 | 0 |