Somerset South and West Management Catchment
About
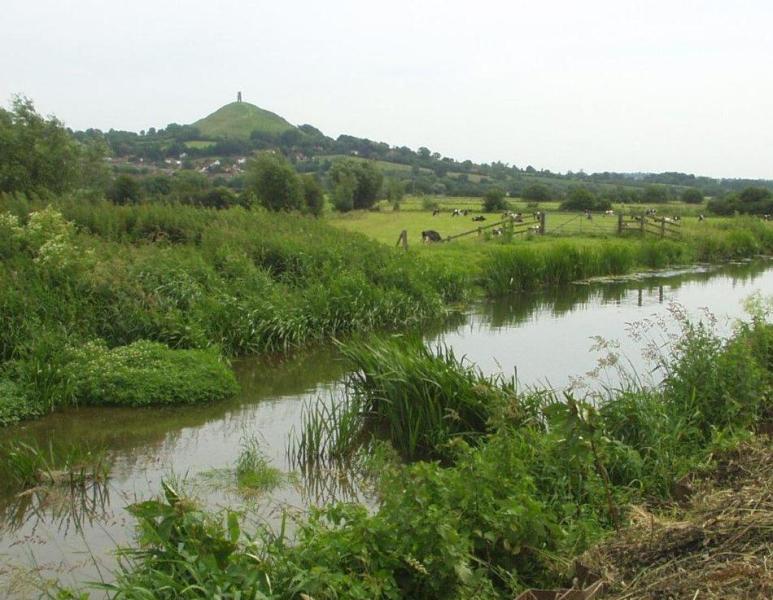
The South and West Somerset (S&WS) management catchment is a varied landform and includes the manmade Somerset Levels and Moors (SL&M), mostly below sea level. The rivers Parrett, Tone, Brue and Axe, which flow into the SL&M, are influenced in their river chemistry, flow and form by the surrounding hills. The West Somerset Streams flow from Exmoor and are flashy in nature. This catchment includes the Bridgwater and Taunton canal. On the SL&M, rivers have been modified and embanked; levels and flow are manipulated with sluices and pumps to produce lowland wet grassland and wet fencing typical of this landscape. The area is one of the largest wetlands in Britain and home to wildlife of national and international importance. The free flowing tidal reaches bring silt upriver from the Severn Estuary which is a designated Special Area for Conservation and Ramsar site. There are EU designated bathing waters located along the coast. Water is stored in the catchment and used for public water supply and industry. Agriculture is the dominant land use, mainly arable, dairy and beef. The countryside and coastline is important economically for tourism and recreation. The lakes and reservoirs in the catchment are popular for fishing, boating and walking and there is commercial fishing for elvers in the tidal rivers. The River Axe is currently included within the Bristol Avon and North Somerset Streams (BA&NSS) management catchment (Severn RBD). We are proposing amending the management catchment boundary so the Axe is included in the S&WS management catchment. Therefore, this document refers to the Brue and Axe operational catchment which is the proposed operational catchment to be included in the S&WS management catchment.
Classifications data for Somerset South and West Management Catchment
Number of water bodies
The number of water bodies in the river basin district. It shows whether these are natural, artificial (such as canals and reservoirs) or have been modified ('heavily modified') for particular uses.
| Water body categories | Natural | Artificial | Heavily modified | Total |
|---|---|---|---|---|
| River, canals and surface water transfers | 68 | 12 | 20 | 100 |
| Lake | 0 | 7 | 4 | 11 |
| Coastal | 0 | 0 | 0 | 0 |
| Estuarine | 0 | 0 | 0 | 0 |
| Groundwater | 0 | 0 | 0 | 0 |
| Total | 68 | 19 | 24 | 111 |
Ecological status for surface waters
Table summarises the current ecological status of surface water bodies. Water bodies are classified as being at high, good, moderate, poor or bad ecological status or potential.
| Ecological status or potential | Bad | Poor | Moderate | Good | High | Total |
|---|---|---|---|---|---|---|
| Number of water bodies | 1 | 19 | 84 | 7 | 0 | 111 |
| Number of water body elements | 16 | 82 | 121 | 129 | 566 | 914 |
Chemical status for surface waters
Table summarises the current chemical status of water bodies. These are classified as being at good or fail.
| Chemical status | Fail | Good | Total |
|---|---|---|---|
| Number of water bodies | 111 | 0 | 111 |
| Number of water body elements | 246 | 1163 | 1409 |
Quantitative status for groundwater
Table summarises the quantitative status of groundwater water bodies. These are classified as being at good or poor.
| Quantitative status | Poor | Good | Total |
|---|---|---|---|
| Number of water bodies | 0 | 0 | 0 |
| Number of water body elements | 0 | 0 | 0 |
Chemical status for groundwater
Table summarises the chemical status of groundwater water bodies. These are classified as being at good or poor.
| Chemical status | Poor | Good | Total |
|---|---|---|---|
| Number of water bodies | 0 | 0 | 0 |
| Number of water body elements | 0 | 0 | 0 |
Challenges data for Somerset South and West Management Catchment
Reasons for not achieving good status by business sector
The issues preventing waters reaching good status and the sectors identified as contributing to them. The numbers in the table are individual counts of the reasons for not achieving good status with a confidence status of 'confirmed' and 'probable', where the latest classification is less than good status. There may be more than one reason in a single water body. Note, table does not include reasons for deterioration.
| Significant water management issue | Changes to the natural flow and level of water | Invasive non-native species | Physical modifications | Pollution from abandoned mines | Pollution from rural areas | Pollution from towns, cities and transport | Pollution from waste water |
|---|---|---|---|---|---|---|---|
| Agriculture and rural land management | 10 | 0 | 49 | 0 | 154 | 0 | 0 |
| Domestic general public | 0 | 0 | 0 | 0 | 0 | 5 | 2 |
| Industry | 0 | 0 | 5 | 0 | 0 | 10 | 0 |
| Local & central government | 0 | 0 | 18 | 0 | 0 | 0 | 0 |
| Mining and quarrying | 0 | 0 | 0 | 6 | 0 | 0 | 0 |
| Navigation | 0 | 0 | 0 | 0 | 0 | 0 | 0 |
| No sector responsible | 0 | 1 | 0 | 0 | 0 | 0 | 0 |
| Other | 1 | 0 | 5 | 0 | 0 | 2 | 0 |
| Recreation | 0 | 0 | 2 | 0 | 0 | 0 | 0 |
| Sector under investigation | 0 | 0 | 8 | 0 | 0 | 0 | 0 |
| Urban and transport | 0 | 0 | 14 | 0 | 0 | 13 | 0 |
| Waste treatment and disposal | 0 | 0 | 0 | 0 | 0 | 1 | 3 |
| Water Industry | 2 | 0 | 8 | 0 | 0 | 0 | 88 |
| Total | 13 | 1 | 109 | 6 | 154 | 31 | 93 |
Objectives data for Somerset South and West Management Catchment
Ecological status or potential objectives for surface water bodies
Table summarises the ecological status and ecological potential objectives set for water bodies in the river basin management plan. Each water body is only counted once in this table. Each water body objective consists of a target status and a date when it was, or is expected to be, met.
| Status | Bad | Poor | Moderate | Good | High | Total |
|---|---|---|---|---|---|---|
| By 2015 | 0 | 1 | 20 | 7 | 0 | 28 |
| By 2021 | 0 | 0 | 4 | 1 | 0 | 5 |
| By 2027 | 0 | 0 | 3 | 75 | 0 | 78 |
| Total | 0 | 1 | 27 | 83 | 0 | 111 |
Chemical status objectives for surface water bodies
Including those with less stringent objectives and extended deadlines
| Status | Fail | Good | Total |
|---|---|---|---|
| By 2063 | 0 | 111 | 111 |
| Total | 0 | 111 | 111 |
Quantitative status objectives for groundwater
Including those with less stringent objectives and extended deadlines
| Status | Poor | Good | Total |
|---|---|---|---|
| Total | 0 | 0 | 0 |
Chemical status objectives for groundwater
Including those with less stringent objectives and extended deadlines
| Status | Poor | Good | Total |
|---|---|---|---|
| Total | 0 | 0 | 0 |