Kennet and Trib Management Catchment
About
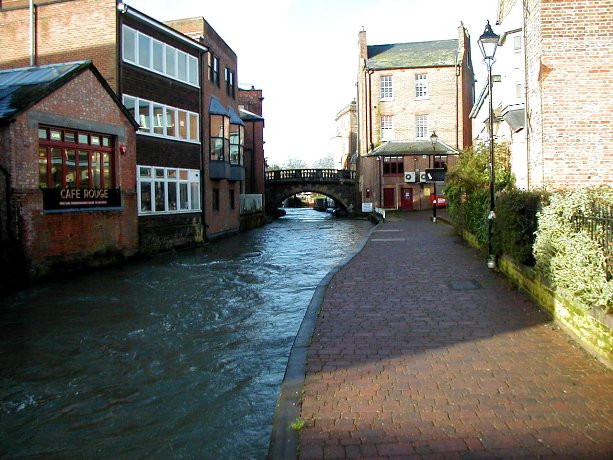
The Kennet catchment is made up of the River Kennet with its main tributaries the Lambourn, Enborne and Foudry Brook. The upper stretches of the Kennet are mainly rural the river passes through Marlborough, Hungerford, Newbury and Reading before reaching the River Thames.The River Kennet is a Site of Special Scientific Interest from Marlborough to Woolhampton, as is the entire Lambourn, which is also a Special Area of Conservation under the EU Habitats Directive. Both of these are chalk rivers of national and international importance due to the wildlife they support. They are also valuable economic and recreational assets for the area. They are home to wild brown trout and are characterised by chalkstream aquatic plant species such as Rununculus. The River Kennet has been affected by significant changes in the way the land has been used. Over the last 80 years there has been a considerable reduction in land under permanent pasture, while land cultivated for arable crops has trebled. Urban areas and transport links have expanded to accommodate a growing population. In the past few years, working in collaboration with landowners and local wildlife groups, millions has been spend on river restoration schemes on the River Kennet and Lambourn. These have improved the quality of the environment , stimulating educational initiatives and getting people involved in caring for their rivers.
Classifications data for Kennet and Trib Management Catchment
Number of water bodies
The number of water bodies in the river basin district. It shows whether these are natural, artificial (such as canals and reservoirs) or have been modified ('heavily modified') for particular uses.
| Water body categories | Natural | Artificial | Heavily modified | Total |
|---|---|---|---|---|
| River, canals and surface water transfers | 28 | 0 | 1 | 29 |
| Lake | 0 | 2 | 2 | 4 |
| Coastal | 0 | 0 | 0 | 0 |
| Estuarine | 0 | 0 | 0 | 0 |
| Groundwater | 0 | 0 | 0 | 0 |
| Total | 28 | 2 | 3 | 33 |
Ecological status for surface waters
Table summarises the current ecological status of surface water bodies. Water bodies are classified as being at high, good, moderate, poor or bad ecological status or potential.
| Ecological status or potential | Bad | Poor | Moderate | Good | High | Total |
|---|---|---|---|---|---|---|
| Number of water bodies | 0 | 3 | 23 | 7 | 0 | 33 |
| Number of water body elements | 0 | 9 | 40 | 42 | 206 | 297 |
Chemical status for surface waters
Table summarises the current chemical status of water bodies. These are classified as being at good or fail.
| Chemical status | Fail | Good | Total |
|---|---|---|---|
| Number of water bodies | 33 | 0 | 33 |
| Number of water body elements | 47 | 438 | 485 |
Quantitative status for groundwater
Table summarises the quantitative status of groundwater water bodies. These are classified as being at good or poor.
| Quantitative status | Poor | Good | Total |
|---|---|---|---|
| Number of water bodies | 0 | 0 | 0 |
| Number of water body elements | 0 | 0 | 0 |
Chemical status for groundwater
Table summarises the chemical status of groundwater water bodies. These are classified as being at good or poor.
| Chemical status | Poor | Good | Total |
|---|---|---|---|
| Number of water bodies | 0 | 0 | 0 |
| Number of water body elements | 0 | 0 | 0 |
Challenges data for Kennet and Trib Management Catchment
Reasons for not achieving good status by business sector
The issues preventing waters reaching good status and the sectors identified as contributing to them. The numbers in the table are individual counts of the reasons for not achieving good status with a confidence status of 'confirmed' and 'probable', where the latest classification is less than good status. There may be more than one reason in a single water body. Note, table does not include reasons for deterioration.
| Significant water management issue | Changes to the natural flow and level of water | Invasive non-native species | Physical modifications | Pollution from abandoned mines | Pollution from rural areas | Pollution from towns, cities and transport | Pollution from waste water |
|---|---|---|---|---|---|---|---|
| Agriculture and rural land management | 0 | 0 | 4 | 0 | 2 | 0 | 0 |
| Domestic general public | 0 | 0 | 0 | 0 | 0 | 0 | 0 |
| Industry | 0 | 0 | 0 | 0 | 0 | 0 | 0 |
| Local & central government | 0 | 0 | 0 | 0 | 0 | 0 | 0 |
| Mining and quarrying | 0 | 0 | 0 | 0 | 0 | 0 | 0 |
| Navigation | 0 | 0 | 0 | 0 | 0 | 0 | 0 |
| No sector responsible | 0 | 0 | 1 | 0 | 0 | 0 | 0 |
| Other | 0 | 0 | 5 | 0 | 0 | 0 | 0 |
| Recreation | 0 | 0 | 3 | 0 | 0 | 0 | 0 |
| Sector under investigation | 0 | 0 | 0 | 0 | 0 | 0 | 0 |
| Urban and transport | 0 | 0 | 0 | 0 | 0 | 0 | 0 |
| Waste treatment and disposal | 0 | 0 | 0 | 0 | 0 | 0 | 0 |
| Water Industry | 2 | 0 | 1 | 0 | 0 | 0 | 10 |
| Total | 2 | 0 | 14 | 0 | 2 | 0 | 10 |
Objectives data for Kennet and Trib Management Catchment
Ecological status or potential objectives for surface water bodies
Table summarises the ecological status and ecological potential objectives set for water bodies in the river basin management plan. Each water body is only counted once in this table. Each water body objective consists of a target status and a date when it was, or is expected to be, met.
| Status | Bad | Poor | Moderate | Good | High | Total |
|---|---|---|---|---|---|---|
| By 2015 | 0 | 0 | 5 | 5 | 0 | 10 |
| By 2021 | 0 | 0 | 0 | 3 | 0 | 3 |
| By 2027 | 0 | 0 | 0 | 12 | 0 | 12 |
| By 2033 | 0 | 0 | 0 | 1 | 0 | 1 |
| By 2039 | 0 | 0 | 0 | 7 | 0 | 7 |
| Total | 0 | 0 | 5 | 28 | 0 | 33 |
Chemical status objectives for surface water bodies
Including those with less stringent objectives and extended deadlines
| Status | Fail | Good | Total |
|---|---|---|---|
| By 2063 | 0 | 33 | 33 |
| Total | 0 | 33 | 33 |
Quantitative status objectives for groundwater
Including those with less stringent objectives and extended deadlines
| Status | Poor | Good | Total |
|---|---|---|---|
| Total | 0 | 0 | 0 |
Chemical status objectives for groundwater
Including those with less stringent objectives and extended deadlines
| Status | Poor | Good | Total |
|---|---|---|---|
| Total | 0 | 0 | 0 |
Summary Statistics data for Kennet and Trib Management Catchment
Ecological status and potential
| Summary statistic | Rivers, Canals and SWTs | Lakes | Estuaries | Coastal | Surface Waters Combined |
|---|---|---|---|---|---|
| % of water bodies at good or better ecological status/potential | 21% | 25% | 21% | ||
| % of biological elements, phys-chem elements and specific pollutants at good or better status | 83% | 57% | 82% | ||
| % of water bodies with an objective of good ecological status/potential or better | 83% | 100% | 85% | ||
| % of biological elements, phys-chem elements and Specific Pollutants with an objective of good status or better | 97% | 100% | 97% |
Chemical
| Summary statistic | Rivers, Canals and SWTs | Lakes | Estuaries | Coastal | Surface Waters Combined |
|---|---|---|---|---|---|
| % of water bodies at good chemical status | 0% | 0% | 0% | ||
| % of chemical elements at good status | 90% | 90% | 90% | ||
| % of water bodies at good chemical status without uPBT | 86% | 100% | 88% | ||
| % of chemical elements at good status without uPBT | 98% | 100% | 98% | ||
| % of water bodies with an objective of good chemical status | 100% | 100% | 100% | ||
| % of chemical elements with an objective of good | 100% | 100% | 100% | ||
| % of water bodies with an objective of good chemical status without uPBT | 100% | 100% | 100% | ||
| % of chemical elements with an objective of good without uPBTs | 100% | 100% | 100% |