Wey Operational Catchment
About
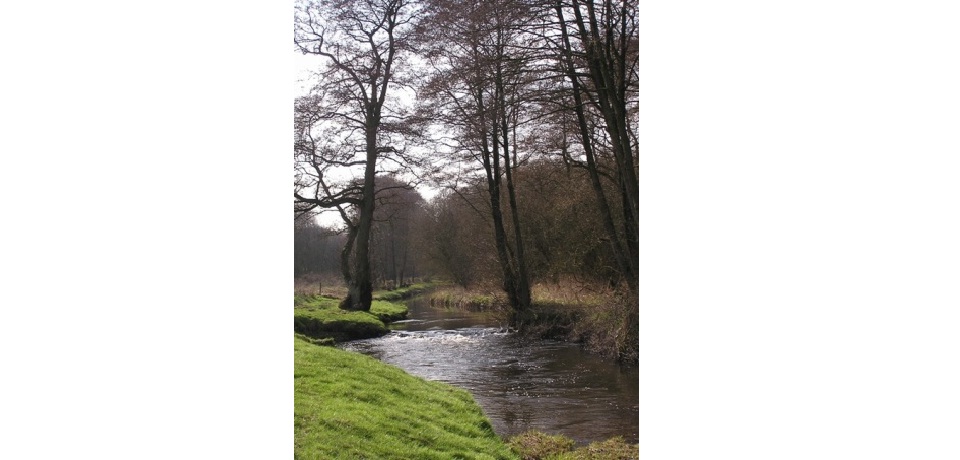
The River Wey flows off the South Downs and through the North Downs and the Surrey countryside. As such the landscape is a mix of rural with urban centres like Guildford. The River Wey is a southern tributary of the River Thames and rises as two main headwaters, the North Wey near Alton and the South Wey near Haselmere. The Wey Valley contains valuable floodplain grazing marsh, a priority UK Biodiversity Action Plan habitat that provides feeding opportunities for wintering wading birds. The Wey catchment also contains large areas of lowland heathland, which is important internationally. Protected species include otters that are slowly returning to the Wey catchment, while numbers of water voles are decreasing, mainly because of mink in the area. Native brown trout can be found in the catchment, mostly in the headwaters.
Classifications data for Wey Operational Catchment
Number of water bodies
The number of water bodies in the river basin district. It shows whether these are natural, artificial (such as canals and reservoirs) or have been modified ('heavily modified') for particular uses.
| Water body categories | Natural | Artificial | Heavily modified | Total |
|---|---|---|---|---|
| River, canals and surface water transfers | 26 | 1 | 4 | 31 |
| Lake | 4 | 2 | 5 | 11 |
| Coastal | 0 | 0 | 0 | 0 |
| Estuarine | 0 | 0 | 0 | 0 |
| Groundwater | 0 | 0 | 0 | 0 |
| Total | 30 | 3 | 9 | 42 |
Ecological status for surface waters
Table summarises the current ecological status of surface water bodies. Water bodies are classified as being at high, good, moderate, poor or bad ecological status or potential.
| Ecological status or potential | Bad | Poor | Moderate | Good | High | Total |
|---|---|---|---|---|---|---|
| Number of water bodies | 4 | 13 | 23 | 2 | 0 | 42 |
| Number of water body elements | 7 | 24 | 64 | 58 | 214 | 367 |
Chemical status for surface waters
Table summarises the current chemical status of water bodies. These are classified as being at good or fail.
| Chemical status | Fail | Good | Total |
|---|---|---|---|
| Number of water bodies | 42 | 0 | 42 |
| Number of water body elements | 79 | 460 | 539 |
Quantitative status for groundwater
Table summarises the quantitative status of groundwater water bodies. These are classified as being at good or poor.
| Quantitative status | Poor | Good | Total |
|---|---|---|---|
| Number of water bodies | 0 | 0 | 0 |
| Number of water body elements | 0 | 0 | 0 |
Chemical status for groundwater
Table summarises the chemical status of groundwater water bodies. These are classified as being at good or poor.
| Chemical status | Poor | Good | Total |
|---|---|---|---|
| Number of water bodies | 0 | 0 | 0 |
| Number of water body elements | 0 | 0 | 0 |
Challenges data for Wey Operational Catchment
Reasons for not achieving good status by business sector
The issues preventing waters reaching good status and the sectors identified as contributing to them. The numbers in the table are individual counts of the reasons for not achieving good status with a confidence status of 'confirmed' and 'probable', where the latest classification is less than good status. There may be more than one reason in a single water body. Note, table does not include reasons for deterioration.
| Significant water management issue | Changes to the natural flow and level of water | Invasive non-native species | Physical modifications | Pollution from abandoned mines | Pollution from rural areas | Pollution from towns, cities and transport | Pollution from waste water |
|---|---|---|---|---|---|---|---|
| Agriculture and rural land management | 0 | 0 | 11 | 0 | 5 | 0 | 0 |
| Domestic general public | 0 | 0 | 1 | 0 | 0 | 0 | 1 |
| Industry | 0 | 0 | 0 | 0 | 0 | 1 | 0 |
| Local & central government | 0 | 0 | 1 | 0 | 0 | 0 | 0 |
| Mining and quarrying | 0 | 0 | 0 | 0 | 0 | 0 | 0 |
| Navigation | 0 | 0 | 4 | 0 | 0 | 0 | 0 |
| No sector responsible | 0 | 0 | 0 | 0 | 0 | 0 | 0 |
| Other | 0 | 0 | 6 | 0 | 0 | 2 | 0 |
| Recreation | 0 | 0 | 6 | 0 | 0 | 0 | 0 |
| Sector under investigation | 0 | 0 | 0 | 0 | 0 | 0 | 0 |
| Urban and transport | 0 | 0 | 4 | 0 | 0 | 7 | 3 |
| Waste treatment and disposal | 0 | 0 | 0 | 0 | 0 | 0 | 0 |
| Water Industry | 3 | 0 | 0 | 0 | 0 | 0 | 30 |
| Total | 3 | 0 | 33 | 0 | 5 | 10 | 34 |
Objectives data for Wey Operational Catchment
Ecological status or potential objectives for surface water bodies
Table summarises the ecological status and ecological potential objectives set for water bodies in the river basin management plan. Each water body is only counted once in this table. Each water body objective consists of a target status and a date when it was, or is expected to be, met.
| Status | Bad | Poor | Moderate | Good | High | Total |
|---|---|---|---|---|---|---|
| By 2015 | 0 | 0 | 3 | 2 | 0 | 5 |
| By 2027 | 0 | 0 | 0 | 29 | 0 | 29 |
| By 2033 | 0 | 0 | 0 | 2 | 0 | 2 |
| By 2039 | 0 | 0 | 1 | 5 | 0 | 6 |
| Total | 0 | 0 | 4 | 38 | 0 | 42 |
Chemical status objectives for surface water bodies
Including those with less stringent objectives and extended deadlines
| Status | Fail | Good | Total |
|---|---|---|---|
| By 2063 | 0 | 42 | 42 |
| Total | 0 | 42 | 42 |
Quantitative status objectives for groundwater
Including those with less stringent objectives and extended deadlines
| Status | Poor | Good | Total |
|---|---|---|---|
| Total | 0 | 0 | 0 |
Chemical status objectives for groundwater
Including those with less stringent objectives and extended deadlines
| Status | Poor | Good | Total |
|---|---|---|---|
| Total | 0 | 0 | 0 |
Summary Statistics data for Wey Operational Catchment
Ecological status and potential
| Summary statistic | Rivers, Canals and SWTs | Lakes | Estuaries | Coastal | Surface Waters Combined |
|---|---|---|---|---|---|
| % of water bodies at good or better ecological status/potential | 3% | 9% | 5% | ||
| % of biological elements, phys-chem elements and specific pollutants at good or better status | 75% | 64% | 74% | ||
| % of water bodies with an objective of good ecological status/potential or better | 87% | 100% | 90% | ||
| % of biological elements, phys-chem elements and Specific Pollutants with an objective of good status or better | 98% | 100% | 99% |
Chemical
| Summary statistic | Rivers, Canals and SWTs | Lakes | Estuaries | Coastal | Surface Waters Combined |
|---|---|---|---|---|---|
| % of water bodies at good chemical status | 0% | 0% | 0% | ||
| % of chemical elements at good status | 86% | 84% | 85% | ||
| % of water bodies at good chemical status without uPBT | 58% | 100% | 69% | ||
| % of chemical elements at good status without uPBT | 92% | 100% | 94% | ||
| % of water bodies with an objective of good chemical status | 100% | 100% | 100% | ||
| % of chemical elements with an objective of good | 100% | 100% | 100% | ||
| % of water bodies with an objective of good chemical status without uPBT | 100% | 100% | 100% | ||
| % of chemical elements with an objective of good without uPBTs | 100% | 100% | 100% |