How to use the Ecology & Fish Data Explorer
The data explorer can be used to search, filter and download the Environment Agency's fish and ecology open data. Freshwater and marine survey data are extracted from the National Fish Populations database (NFPD) and Biosys (Biological survey) database. By using the data explorer's filters, you can focus on the spatial area and time-frame that you are interested in, and then download the data particular to your needs.
If you are interested in all available data across the country, you can download all the datasets from the Bulk Downloads page. You cannot download the full dataset using the map interface as the datasets are too large.
To keep load times to a minimum, try and restrict the data to particular years or areas. The rest of this page will show you how to use the explorer interface to do that. There is also a ‘Tips and Troubleshooting’ section at the bottom of this page, if you are having problems loading the explorer.
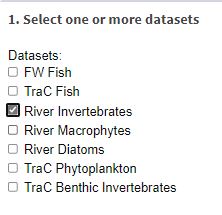
1. Select one or more datasets
Seven datasets are displayed. These are pre-fixed with either: Freshwater (FW), Transitional and Coastal (TraC) or River. You can select multiple datasets to display on the map by selecting the tick boxes, but you must select at least one. In the example below, only the River Invertebrates dataset has been selected:
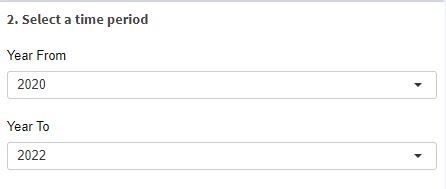
2. Select a time period
Select ‘Year From’ and ‘Year To’ using the drop-down boxes to load data for the years you are interested in:
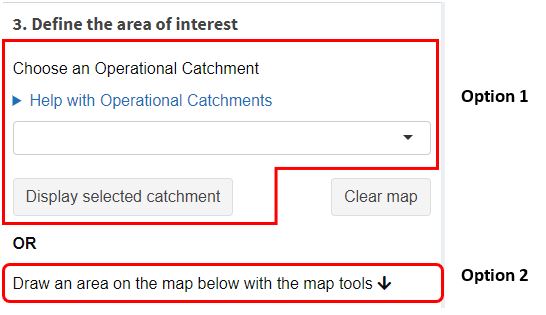
3. Define the area of interest
There are two options within this box to allow you to define your area of interest. You can either choose an Operational Catchment (Option 1) or draw your area on the map (Option 2).
Option 1. Choose an Operational Catchment:
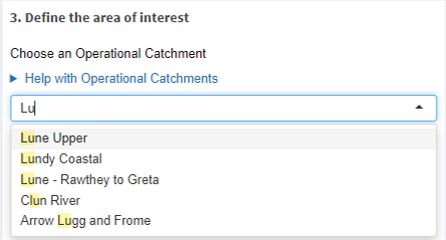
You can select an Operational Catchment from the box as shown below. Once you have selected your Operational Catchment you must click on the ‘Display selected catchment’ button to display the catchment outline on the map.
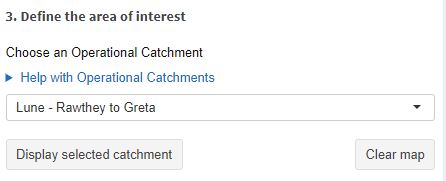
To select your catchment, you can either start typing, if you know the name (or part of the name), or you can click on the drop-down box and scroll through the available catchments. In the example shown above the ‘Lune – Rawthey to Greta’ catchment has been selected. To search for this by typing the name, you can type ‘Lu’ to see catchments beginning with, or containing, that text. You can then select the relevant catchment from the displayed list (see below). Note that the search is not case-sensitive:
If you select the wrong catchment, simply click back into the selection box and delete the catchment name using the backspace key on your keyboard. Re-select the catchment you are interested in and press the ‘Display selected catchment’ button. Alternatively, to remove the catchment outline from the map, simply press the ‘Clear map’ button in box 3.
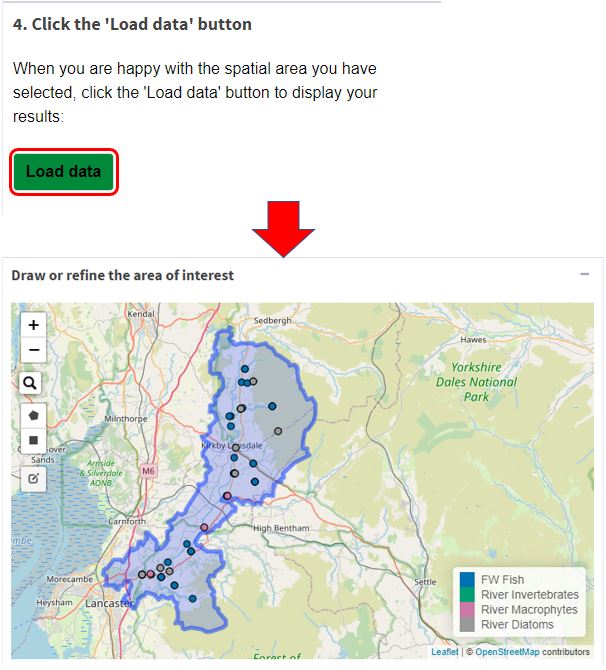
Once you are happy with your catchment selection, press the ‘Load data’ button in box 4 to display your results:
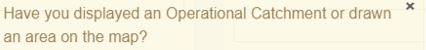
Note: if you forget to press the ‘Display selected catchment’ button, before clicking the ‘Load data’ button, you will see an error message at the top of your screen with the prompt below:
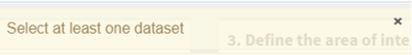
If you have forgotten to select a dataset you will see the error message below:
Help with Operational Catchments
You can click on the ‘Help with Operational Catchments’ link to see further information. The Operational Catchments available for selection, are the WFD (Water Framework Directive) Surface Water Operational Catchments. As these catchments are used for managing WFD they may not always have recognisable catchment names (particularly for the Transitional and Coastal waterbodies). To view more details about these catchments you can access the Catchment Data Explorer (CDE). Once on the CDE home page you can search for individual catchments either using the search box or by drilling down through the 'River basin districts' and 'Management catchments', to the 'Operational catchments'. Alternatively, you can scroll down to the Data>Geometry box on the home page and download the list of catchments from the Shapefile/GeoJSON links.
Note that the Operational Catchment list displays English catchments only, used for WFD. This can occasionally mean that there are areas that are not covered by a catchment. For example, some coastal catchments close to the Welsh border. If you are interested in an area that is not covered fully by a catchment you can skip to Option 2 and draw your area on the map.
Option 2. Draw an area on the map:
Use the tools on the left of the map to draw an area on the map and display the sites for your selected dataset(s).
This can be useful if the area you are interested in is not the same size as the relevant catchment outline. You can draw over a catchment shape that is already on the map to help you identify sites outside of that catchment. To draw your shape, you can use either the rectangle tool, or the polygon tool, if you require a more complex shape.
You can zoom in and out of the map using the ‘+’ or ‘-‘ buttons. You can also zoom to a river or geographical area, for example, a town or post-code that you are familiar with, by using the search button. For example, searching for ‘River Severn’ will bring up several options, you can then select the most appropriate and the map will zoom in to that area and highlight the search area with a blue circle. You will then need to draw around the area you are interested in using the map tools. See example screenshots below:
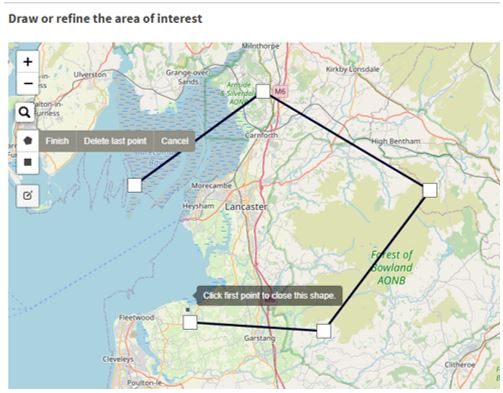
You must join the last section of the polygon to your starting point to complete the shape (or click on the ‘Finish’ button).
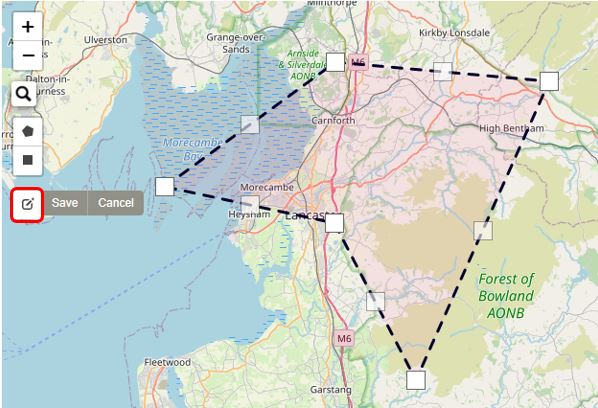
Once a shape is drawn, you can click on the ‘edit layers’ button to adjust its shape as shown below. Press ‘Save’ to confirm the shape.
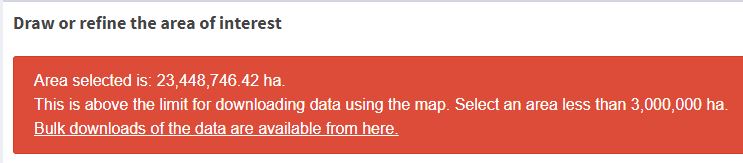
Please note, that you cannot draw an area on the map that is too large or covers the whole country. The area will need to be < 3,000,000 ha or you will see a warning message displayed, as below. If you require a larger area, you should consider downloading the full datasets from the Bulk Downloads page.
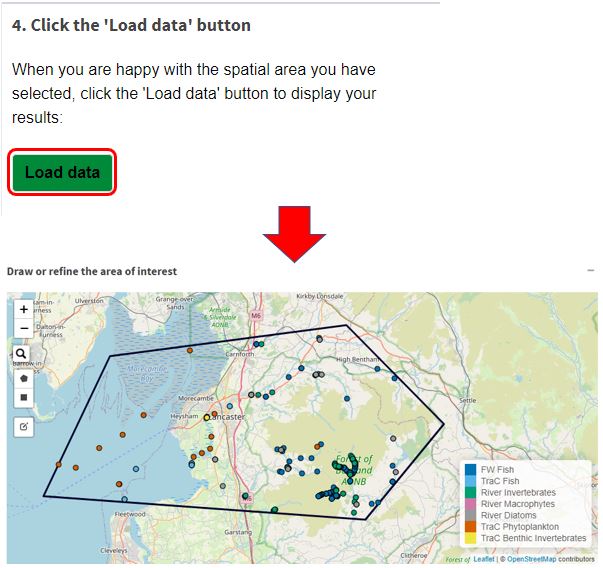
4. Load and display selected data
Once you are happy with your shape (or catchment), you need to press the ‘Load data’ button in box 4 to display your results:
Once you have loaded your data, you can then choose to adjust or draw a new shape or select a different Operational Catchment.
If you wish to draw a completely new area, simply click on the polygon/rectangle button in the map tools and draw a new shape. Once your new shape is complete, then the old one will disappear. You can also press the ‘clear map’ button in box 3 to clear any shape or Operational Catchment from the map and reset it.
Whenever you make a change to the dataset selection, the time period or the catchment/area you must press the ‘Load data’ button to display your new set of results.
Site information
You can click on a point on the map to see a pop-up box with basic information about the site and dataset.
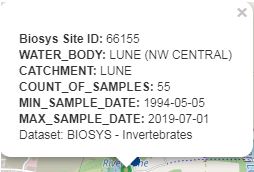
The information displayed in this example is for the invertebrate dataset. Please note that when sites have more than one dataset associated, only one pop-up box will be visible on the map (however data will still appear in the data tables). To view underlying points on the map, you will need to untick the overlying dataset layers.
The information displayed in the pop-up will differ according to the dataset. For the TraC phytoplankton and benthic invertebrate datasets, information about the count of samples and the min/max sample dates are not available.
Base map
You can also choose from different base maps to help you draw your search area on the map. Please note that these datasets are England-only so although you can move the map to other countries you will not see any data displayed.
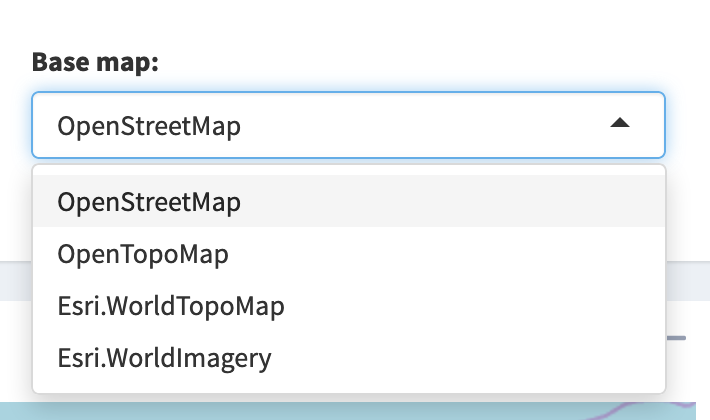
The default map is the OpenStreetMap, which is suited for use on a larger map when you are zoomed out. To see details such as the river outline more easily, when zoomed in, try switching to the OpenTopoMap. For satellite images try the Esri.WorldImagery map.
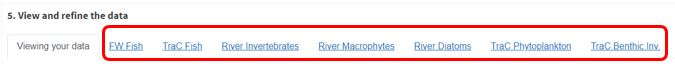
5. View and refine the data
Data are displayed beneath the map in different tabs for each dataset.
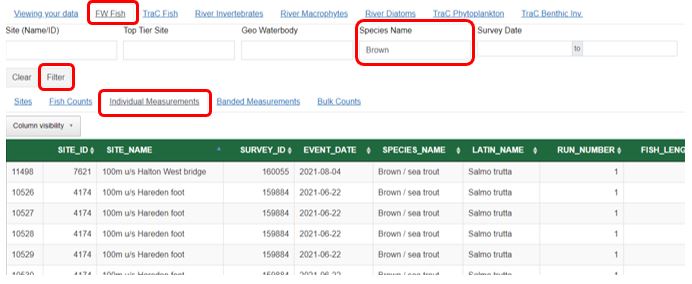
You may choose to further refine your data before downloading. You can do this in each of the tabs by using the filter boxes above the data tables to reduce the data further e.g., by Species Name. Data will be filtered across all relevant tabs for each dataset that the filters apply to. So, for example, if you filter on Species Name when viewing the Fish Counts tab, all the other tabs within the FW Fish dataset will be filtered. The filtering will not apply to invertebrates or any of the other datasets. Filters only apply to the dataset you are viewing when you apply them.
To use the filter boxes, enter a key word or partial word that matches the data. For example; to search for Brown trout you need to enter either the word “Brown” or a partial match such as “Brow”. To enable the filter press ‘Filter’ and to remove the filter press ‘Clear’. Note that the filters are not case-sensitive.
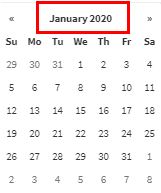
When using the Survey Date filter a calendar will pop-up. Use the arrows to scroll through the months or click into the month and year e.g., January 2020 to see the option of selecting a different year.
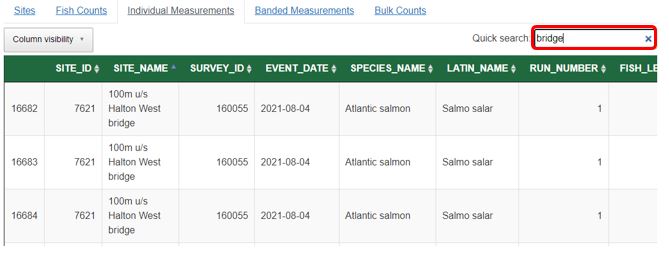
You can also use the ‘Quick search’ box at the top right of each data table, this will search across all records in the data table and show you any resulting matches. The Quick search feature will not affect the resulting download, but is a handy way to check your data contains something you are interested in. You can use partial words/phrases in the Quick-search box and it is not case-sensitive.
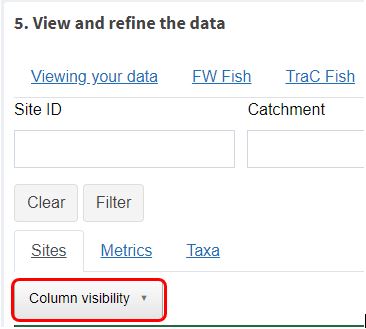
Please note that the datasets are displayed with some columns hidden as default, to make it easier to scan through the main data fields. All columns, whether hidden (or not), will be brought through into any data downloads. If you wish to customise the columns you can see in the interface, you can select and de-select them using the ‘Column visibility’ button.
6. Download your data
Once you have refined your data to your satisfaction, you can use the ‘Download (zip file)’ button to download a zip file to your computer. The zip file will contain several csv files for each of the datasets.

Documentation
You can access the documentation for each of the individual datasets on the documentation page. The documents contain explanations of the fields and include data caveats and warnings to ensure you understand and get the best possible use out of these datasets. Please read them before using the data.
Tips and Troubleshooting
If you have problems loading the map, there are certain things you can try:
- Ensure you are using MS Edge, Google Chrome or Firefox as your internet browser.
- Press F5 or the ‘reload this page’ button

- Try clearing your cache. Click here for instructions on how to do this when in Google Chrome or click here for instructions on how to do this in MS Edge
When looking at an area of interest for the first time on the map, it can be useful to draw a slightly larger area to understand the spread of sites. You can then zoom in further and draw a more targeted area around the data points you are interested in. This will reduce the amount of data in the download and subsequent filtering or manipulation of the data.
Boxes that contain a ‘-’ in the top right corner can be minimised to create more space on your screen. When minimised, this symbol becomes a ‘+’ to allow the box to be maximised.