Wyre Management Catchment
About
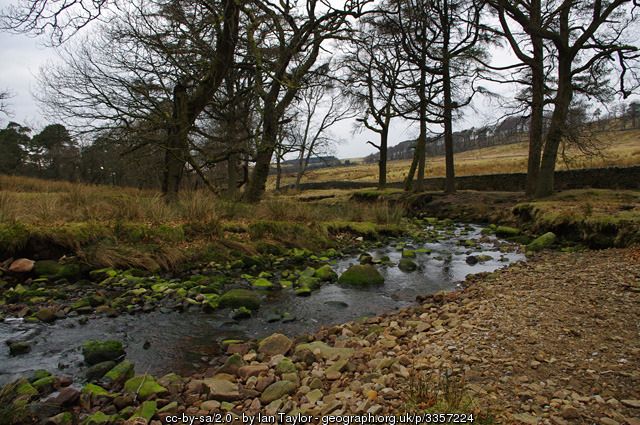
The Wyre Catchment features a wide variety of habitats. The catchment drains a small area in North West Lancashire. It is bordered by the Lune catchment to the North and the Ribble Catchment to the South and East. The upper reaches of the catchment are centred on the Bowland Fells. The catchment then takes in the Amounderness plain at the base of the fells, which features towns such as Garstang and villages that are situated to the north of Preston. The lower catchment takes in the northern Fylde Coast and the villages of the Over Wyre area such as Hambleton and Stalmine. The catchment supports a wide variety of flora and fauna for instance the estuarine area of the catchment is a key feeding location for many internationally important species of wading bird such as the Eurasian Oyster Catcher and the Redshank, whilst the mid river is home to Salmon and Sea Trout. The Bowland Fells at the top of the catchment support many species of bird such as the Marsh Harrier and the Lapwing along with invertebrate species like the Manchester Treble Bar Moth. The vast majority of the Bowland Fells are within the Forest Of Bowland Area of Outstanding Natural Beauty they also host many SPAs and SSSIs, which are areas of habitat that are nationally designated, these designations are in place to protect the flora and fauna that is contained within them.
Classifications data for Wyre Management Catchment
Number of water bodies
The number of water bodies in the river basin district. It shows whether these are natural, artificial (such as canals and reservoirs) or have been modified ('heavily modified') for particular uses.
| Water body categories | Natural | Artificial | Heavily modified | Total |
|---|---|---|---|---|
| River, canals and surface water transfers | 7 | 0 | 7 | 14 |
| Lake | 0 | 1 | 1 | 2 |
| Coastal | 0 | 0 | 0 | 0 |
| Estuarine | 0 | 0 | 0 | 0 |
| Groundwater | 0 | 0 | 0 | 0 |
| Total | 7 | 1 | 8 | 16 |
Ecological status for surface waters
Table summarises the current ecological status of surface water bodies. Water bodies are classified as being at high, good, moderate, poor or bad ecological status or potential.
| Ecological status or potential | Bad | Poor | Moderate | Good | High | Total |
|---|---|---|---|---|---|---|
| Number of water bodies | 1 | 3 | 9 | 3 | 0 | 16 |
| Number of water body elements | 8 | 13 | 24 | 17 | 81 | 143 |
Chemical status for surface waters
Table summarises the current chemical status of water bodies. These are classified as being at good or fail.
| Chemical status | Fail | Good | Total |
|---|---|---|---|
| Number of water bodies | 16 | 0 | 16 |
| Number of water body elements | 35 | 189 | 224 |
Quantitative status for groundwater
Table summarises the quantitative status of groundwater water bodies. These are classified as being at good or poor.
| Quantitative status | Poor | Good | Total |
|---|---|---|---|
| Number of water bodies | 0 | 0 | 0 |
| Number of water body elements | 0 | 0 | 0 |
Chemical status for groundwater
Table summarises the chemical status of groundwater water bodies. These are classified as being at good or poor.
| Chemical status | Poor | Good | Total |
|---|---|---|---|
| Number of water bodies | 0 | 0 | 0 |
| Number of water body elements | 0 | 0 | 0 |
Challenges data for Wyre Management Catchment
Reasons for not achieving good status by business sector
The issues preventing waters reaching good status and the sectors identified as contributing to them. The numbers in the table are individual counts of the reasons for not achieving good status with a confidence status of 'confirmed' and 'probable', where the latest classification is less than good status. There may be more than one reason in a single water body. Note, table does not include reasons for deterioration.
| Significant water management issue | Changes to the natural flow and level of water | Invasive non-native species | Physical modifications | Pollution from abandoned mines | Pollution from rural areas | Pollution from towns, cities and transport | Pollution from waste water |
|---|---|---|---|---|---|---|---|
| Agriculture and rural land management | 0 | 0 | 0 | 0 | 28 | 0 | 0 |
| Domestic general public | 0 | 0 | 0 | 0 | 0 | 7 | 1 |
| Industry | 1 | 0 | 1 | 0 | 0 | 5 | 1 |
| Local & central government | 0 | 0 | 4 | 0 | 0 | 0 | 0 |
| Mining and quarrying | 0 | 0 | 0 | 0 | 0 | 0 | 0 |
| Navigation | 0 | 0 | 0 | 0 | 0 | 0 | 0 |
| No sector responsible | 0 | 0 | 0 | 0 | 0 | 0 | 0 |
| Other | 0 | 0 | 0 | 0 | 0 | 0 | 0 |
| Recreation | 0 | 0 | 0 | 0 | 0 | 0 | 0 |
| Sector under investigation | 0 | 0 | 1 | 0 | 0 | 0 | 0 |
| Urban and transport | 0 | 0 | 3 | 0 | 0 | 3 | 1 |
| Waste treatment and disposal | 0 | 0 | 0 | 0 | 0 | 0 | 0 |
| Water Industry | 0 | 0 | 0 | 0 | 0 | 0 | 7 |
| Total | 1 | 0 | 9 | 0 | 28 | 15 | 10 |
Objectives data for Wyre Management Catchment
Ecological status or potential objectives for surface water bodies
Table summarises the ecological status and ecological potential objectives set for water bodies in the river basin management plan. Each water body is only counted once in this table. Each water body objective consists of a target status and a date when it was, or is expected to be, met.
| Status | Bad | Poor | Moderate | Good | High | Total |
|---|---|---|---|---|---|---|
| By 2015 | 0 | 0 | 0 | 3 | 0 | 3 |
| By 2021 | 0 | 0 | 0 | 1 | 0 | 1 |
| By 2027 | 0 | 0 | 0 | 12 | 0 | 12 |
| Total | 0 | 0 | 0 | 16 | 0 | 16 |
Chemical status objectives for surface water bodies
Including those with less stringent objectives and extended deadlines
| Status | Fail | Good | Total |
|---|---|---|---|
| By 2063 | 0 | 16 | 16 |
| Total | 0 | 16 | 16 |
Quantitative status objectives for groundwater
Including those with less stringent objectives and extended deadlines
| Status | Poor | Good | Total |
|---|---|---|---|
| Total | 0 | 0 | 0 |
Chemical status objectives for groundwater
Including those with less stringent objectives and extended deadlines
| Status | Poor | Good | Total |
|---|---|---|---|
| Total | 0 | 0 | 0 |